Model, Training, Inference: A Pottery Wheel Analogy

1 Introduction
In the world of machine learning, “model,” “model training algorithm,” and “model inference algorithm” are three terms you keep running into over and over. This article walks through all three from the ground up: what a model actually is, what the computer is really doing while it “trains,” and how we use the model once training is done.
If you don’t already have a basic sense of what machine learning is, it’s worth reading the previous article in this series, What Is Machine Learning?, first — everything below assumes you roughly know what machine learning is trying to do.
- Model: a function with parameters — it takes one thing in and produces another thing out.
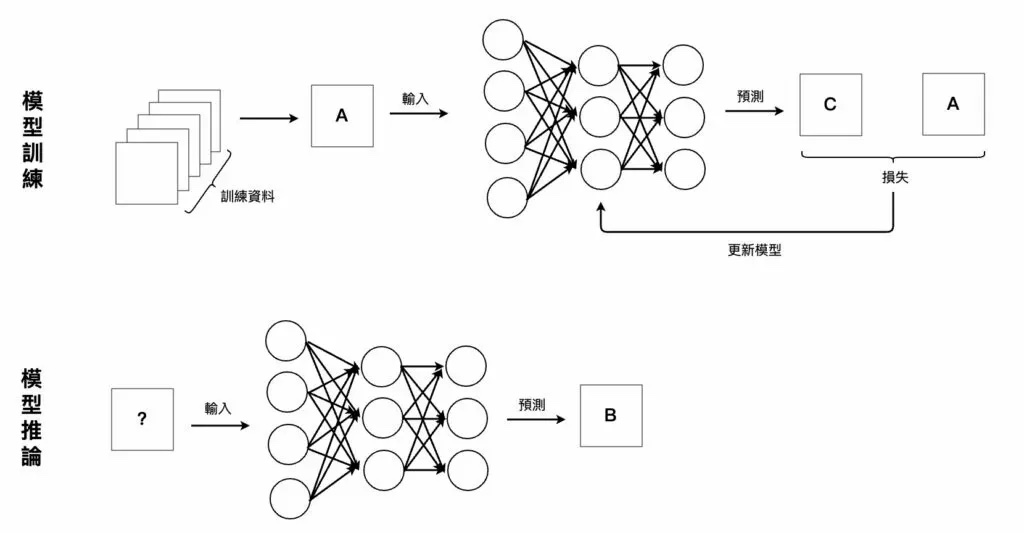
- Training: repeatedly adjusting the model’s parameters until its output reaches a level we’re happy with.
- Inference: using the trained model to make predictions on data it has never seen — the stage where a model actually earns its keep.
- How the three relate: they aren’t three separate things, but the same model seen at three different stages — like throwing pottery: the clay, the shaping, and testing the finished piece.
2 How model, training and inference relate
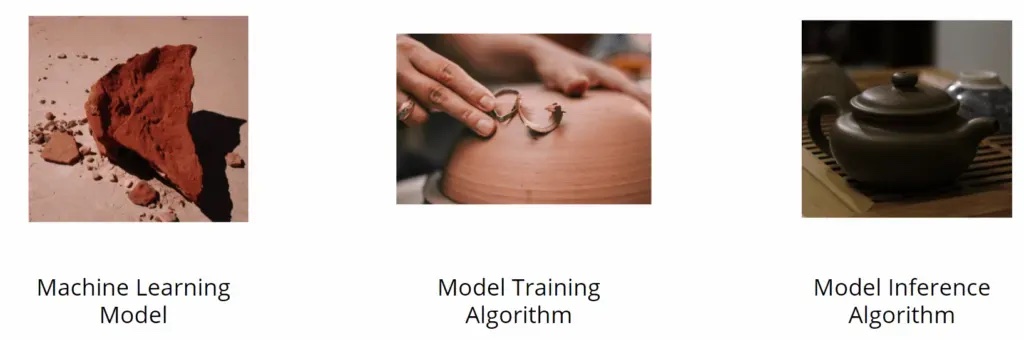
Anyone encountering machine learning for the first time tends to get scared off by a wall of jargon. So before getting into any math, here’s an everyday analogy that ties the three concepts together: throwing pottery on a wheel.
A “model” is like a lump of clay that hasn’t been shaped yet. “Training” is the process of shaping that clay with your hands — and because different goals call for different shaping techniques, machine learning ends up with just as many different training algorithms. “Inference,” meanwhile, is like testing the finished, fired vessel: you pour some liquid in and confirm it actually holds up.
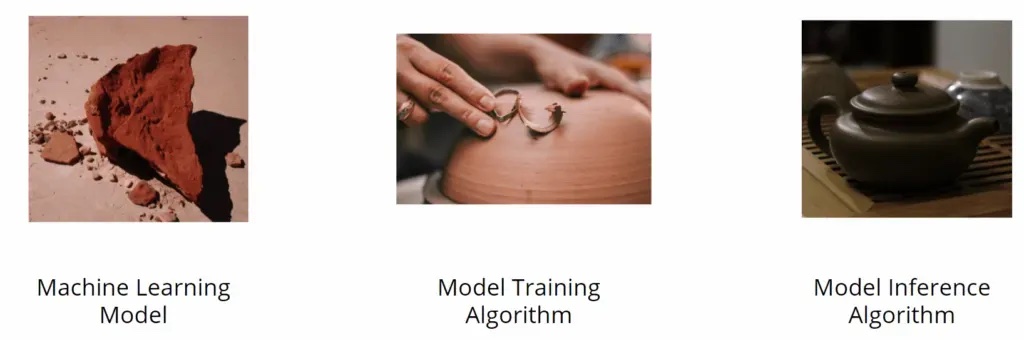
In other words, these three aren’t independent things — they’re the same model shown at different stages.
3 What a machine learning model actually is
Looked at another way, in mathematical terms a model is simply a “function.” Yes, the same y = f(x) you learned back in school. The idea behind a function is simple: feed something in, get something else out.
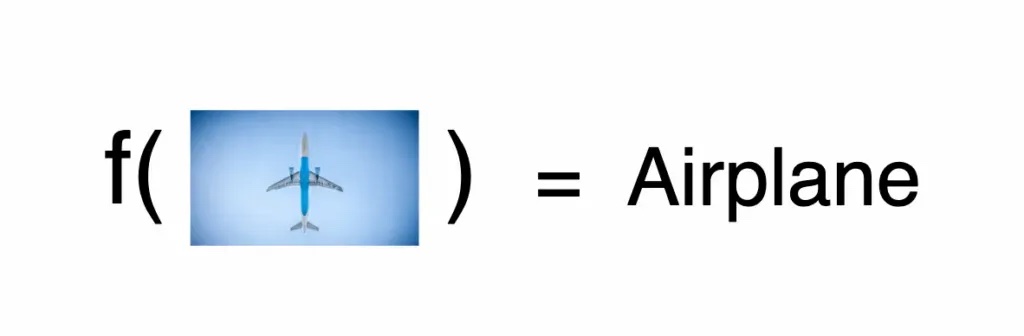
Different problems call for different functions. For example, the diagram below is a function: it takes a picture as input and outputs that picture’s category.
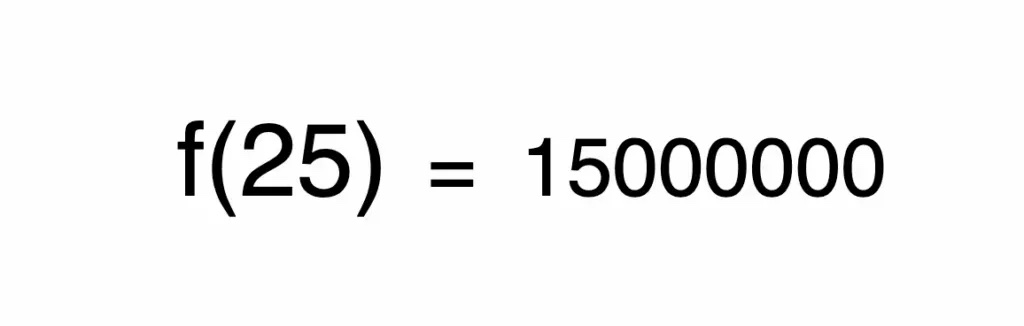
Or take this function instead: it takes a house’s square footage as input and outputs that house’s price. This example will run through the rest of the article, so it’s worth remembering.
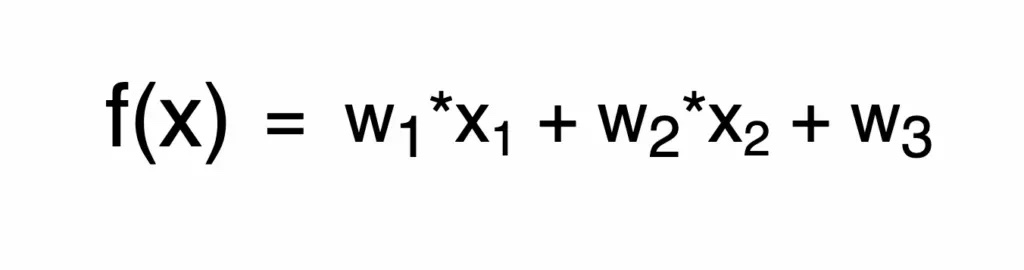
Since a model is a function, it naturally has parameters. For instance, the function below contains three parameters, , , and . These parameters are what the model has actually “learned” — keep the same function shape but swap in a different set of parameters, and you get an entirely different model.
Back to the house-price example. To train a model that takes “square footage” in and outputs “price,” we prepare a large number of samples for the model to learn from, where each sample contains two values: (square footage → price).
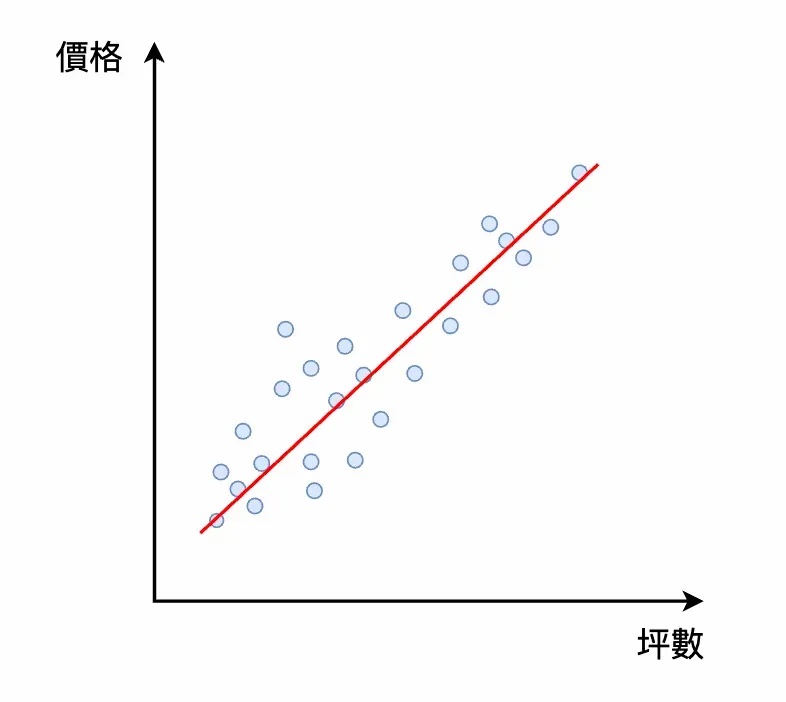
Plotting all of these (square footage → price) samples on a two-dimensional plane gives us the blue dots in the diagram. We want the model to automatically adjust its own parameters using these blue dots, so that after we feed in a square footage, it outputs a sufficiently accurate price. In other words, the red line in the diagram is the model we’re hoping to end up with.
4 What training a model actually is
The process by which “a model learns to adjust its own parameters” is what we call training the model.
Training is a loop that repeats over and over, and each round involves two actions:
- Figuring out the direction and size of the adjustment to make to the model’s parameters
- Actually adjusting those parameters
We repeat these two actions until the model’s output reaches a level we’re satisfied with.
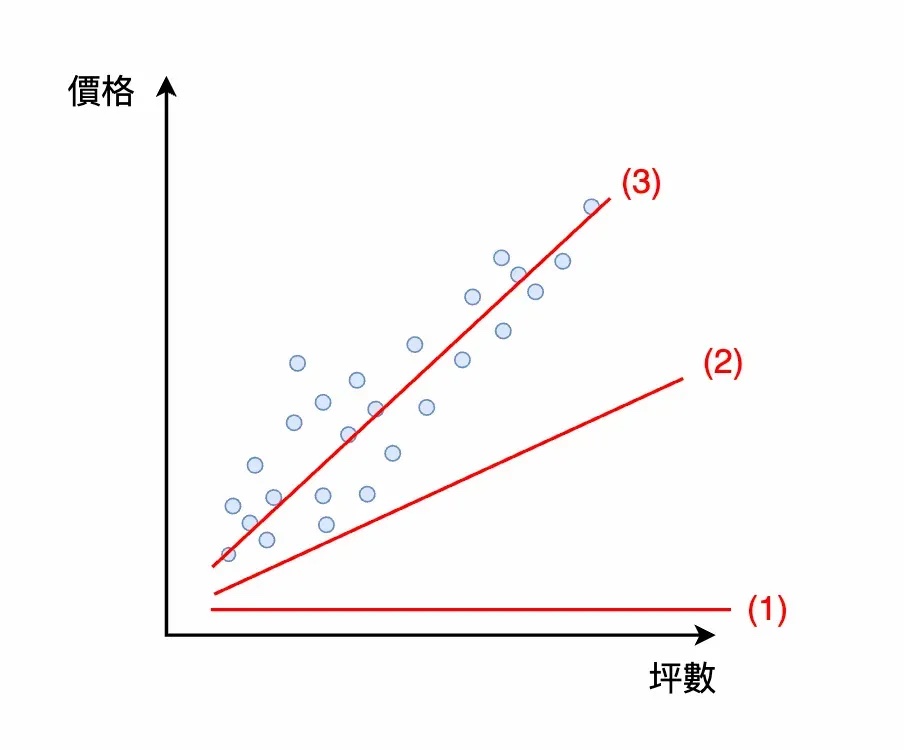
Take the “input square footage, output price” model as an example. At the very start, the model might just be a flat, horizontal line (1) — no matter what square footage you feed in, it spits out the same price every time, which is obviously useless. After one round of parameter adjustment, it becomes a slightly tilted line (2): the bigger the square footage, the bigger the output price, so the output is starting to make sense. As the parameters get adjusted more and more times, the price predictions keep getting more accurate, and eventually it becomes the model we actually want (3).
5 What inference on a model actually is
Once a model has finished training, its internal parameters have already been adjusted many times, and its output reaches a satisfying level across different inputs. What comes next is the inference stage. Put simply, inference means we now formally start “using the model.”
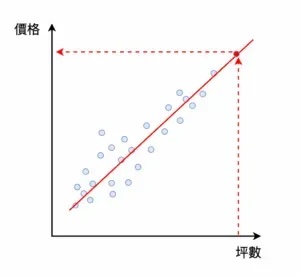
In the “input square footage, output price” example, the model saw the blue samples in the diagram during training, and after many rounds of parameter adjustment it has become the current model (the red line). In the future, whenever we get a sample that only has square footage and no price, we can feed it into this trained model and get back a predicted price (the red dot). This is also the stage where the model actually delivers value: training happens only once, but inference gets used over and over, countless times.
6 Conclusion
This article walked through model, model training, and model inference in machine learning: a model is a function with parameters, training is the process of repeatedly adjusting those parameters, and inference is using the trained model to predict data it has never seen.
The next article picks up from here and looks at, when we run into a problem that needs machine learning to solve it, what steps to follow to define the problem clearly before solving it step by step.