Cambrian-1: A Fully Open, Vision-Centric Exploration of Multimodal LLMs

1 Introduction
Today, I’m excited to share a paper published by New York University in June 2024: Cambrian-1: A Fully Open, Vision-Centric Exploration of Multimodal LLMs! As the title suggests, this paper specifically focuses on the “vision-centric” aspect to investigate how Vision-Language Models (VLMs) should best be trained.
The paper thoroughly explores various design facets of Vision-Language Models (as indicated by “Explore” in the title). After reading it, I felt I gained a wealth of knowledge (achieving a comprehensive understanding of VLM design) and greatly admire the researchers’ dedication and their contributions to the community!
Furthermore, true to the “Open” in its title, all models and training datasets from this research are completely open-sourced on HuggingFace and GitHub. It’s truly commendable when researchers open-source their costly AI research for public use! (Although some say papers won’t get into top conferences without open-sourcing, we also see many papers that, after being accepted, either take down their GitHub repos or leave just a README. So, I’m genuinely grateful to these researchers who are willing to share.)
After reading this paper, I found the model name “Cambrian-1” truly fascinating! “Cambrian” refers to the “Cambrian Period.” According to Wikipedia’s explanation:
The Cambrian Period is the geological period when animal fossils first began to be found in large numbers in rock strata, with almost all modern animal phyla appearing in an evolutionary radiation event known as the ‘Cambrian explosion.’
Simply put, before the Cambrian period, there weren’t many traces of biological activity. However, starting from the Cambrian period, a massive amount of biological activity emerged, with these animals evolving into various animal phyla, much like bamboo shoots after a spring rain. Some scholars believe:
The Cambrian explosion occurred because animals at this time began to develop “visual capabilities.” They started to possess eye-like organs to perceive light from the world, interpret scenes, and this, in turn, drove the development of animal nervous systems and the formation of intelligence.
This also reminds me of Stanford University Professor Fei-Fei Li’s TED talk in April of this year, “With spatial intelligence, AI will understand the real world,” where she mentioned a similar idea (the Cambrian explosion being linked to the development of animal visual capabilities), emphasizing the importance of computer vision for artificial intelligence. For this study, which aims to thoroughly investigate the “visual capabilities” in Vision-Language Models, the name Cambrian-1 seems to carry a similar significance!
2 Problems and Goals Cambrian-1 Aims to Solve
The first goal of the Cambrian-1 paper is to comprehensively investigate the various design details of Multimodal LLMs (specifically focusing on Vision and Language modalities here, hence also referred to as Vision-Language Models or VLMs in this article). This primarily includes the following five aspects:
- Visual Representation: How should the Visual Encoder in a Vision-Language Model be designed for optimal performance?
- Connector Design: Some papers refer to this as the Projection Layer or Modality Projection. This module’s purpose is to align visual features with text features. How should this module be best designed?
- Instruction Tuning Data: What kind of instruction tuning data helps Vision-Language Models perform better?
- Instruction Tuning Recipe: How should Vision-Language Models be trained? One stage? Two stages?
- Benchmarking: How can we effectively measure the visual capabilities of Vision-Language Models?
Previous VLM methods rarely offered such a comprehensive analysis of every aspect. Moreover, the LLM is a crucial foundation for Vision-Language Models; a powerful LLM often leads to a powerful VLM.
However, this leads to a problem: some studies proposing stronger Vision-Language Models are actually just using stronger LLMs, not genuinely designing better methods for visual representation learning.
Therefore, the second goal of the Cambrian-1 paper is to approach this from a vision-centric perspective, improving VLM performance by enhancing its “visual capabilities,” rather than merely using larger LLMs!
3 Analysis 1: Which Benchmarks Truly Measure VLM’s “Visual Capabilities”?
To explore a VLM’s visual capabilities, the first step is naturally to study its Visual Encoder. More specifically, we need to understand what types of Visual Encoders yield better visual representations that can improve VLM performance on benchmarks.
However, is this approach truly sound? The researchers thought more carefully: If a VLM performs well on a benchmark, does it mean its visual capability (Visual Encoder) is good? Or is it actually its language capability (Large Language Model) that’s good?
Therefore, to know what kind of Visual Encoder truly enhances a VLM’s visual capabilities, the first step is to find suitable benchmarks! To understand if a benchmark genuinely measures a VLM’s visual capability, the authors observed three scenarios when evaluating a VLM on a benchmark:
- Visual Enabled: The normal scenario, where the VLM is provided with an image to answer the question.
- Visual Disabled: A special scenario, where the VLM is not provided with an image to answer the question.
- Random Guess: Simply guessing the answer randomly.
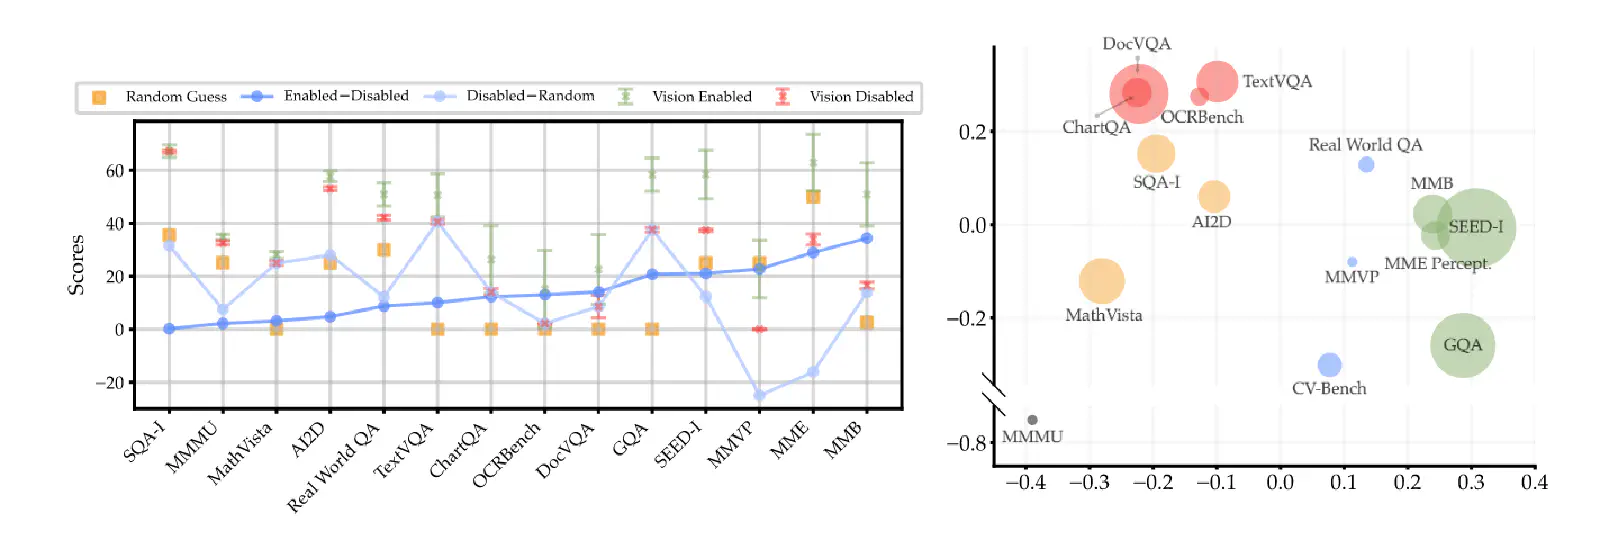
From Figure 3 (left) above, we can see that on the SQA-I, MMMU, and MathVista benchmarks, the scores obtained by the VLM under Visual Enabled and Disabled conditions are almost identical. In simpler terms, whether or not an image is provided to the VLM when answering questions from these benchmarks makes little difference.
This indicates that these benchmarks are not primarily measuring the VLM’s “visual” capability, but rather its “language” capability. In other words, better performance on these benchmarks might just mean the VLM is using a better LLM.
In TextVQA and GQA, Visual Enabled and Disabled conditions do result in different VLM performances, suggesting these benchmarks do measure the VLM’s visual capability to some extent. However, surprisingly, under the Visual Disabled condition, where the VLM cannot see the image and its answers should theoretically be no better than random guesses, Figure 3 (left) shows that Visual Disabled performs much better than Random Guess. This implies that the scores measured by these benchmarks are still influenced by the VLM’s LLM.
Finally, on MMVP and MME, there’s a significant difference in scores between Visual Enabled and Disabled conditions, and the performance under Visual Disabled is even worse than Random Guess. This means that for an MLLM to perform well on these two benchmarks, it truly needs strong visual capabilities to clearly interpret image information! The finding from this analysis is:
4 Open Source 1: CV-Bench — A Benchmark for Measuring VLM Visual Capabilities
Since most existing benchmarks don’t genuinely measure a VLM’s visual capabilities (they are not vision-centric), the authors proposed a new vision-centric benchmark called the Cambrian Vision-Centric Benchmark (CV-Bench), which includes 2638 samples.
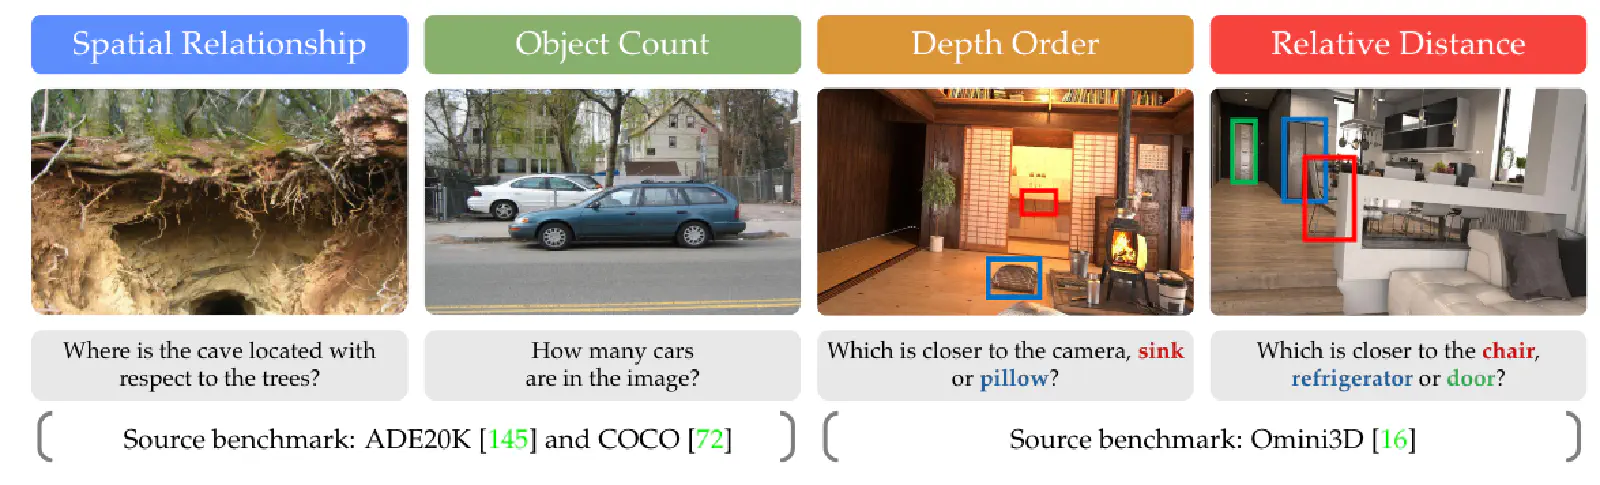
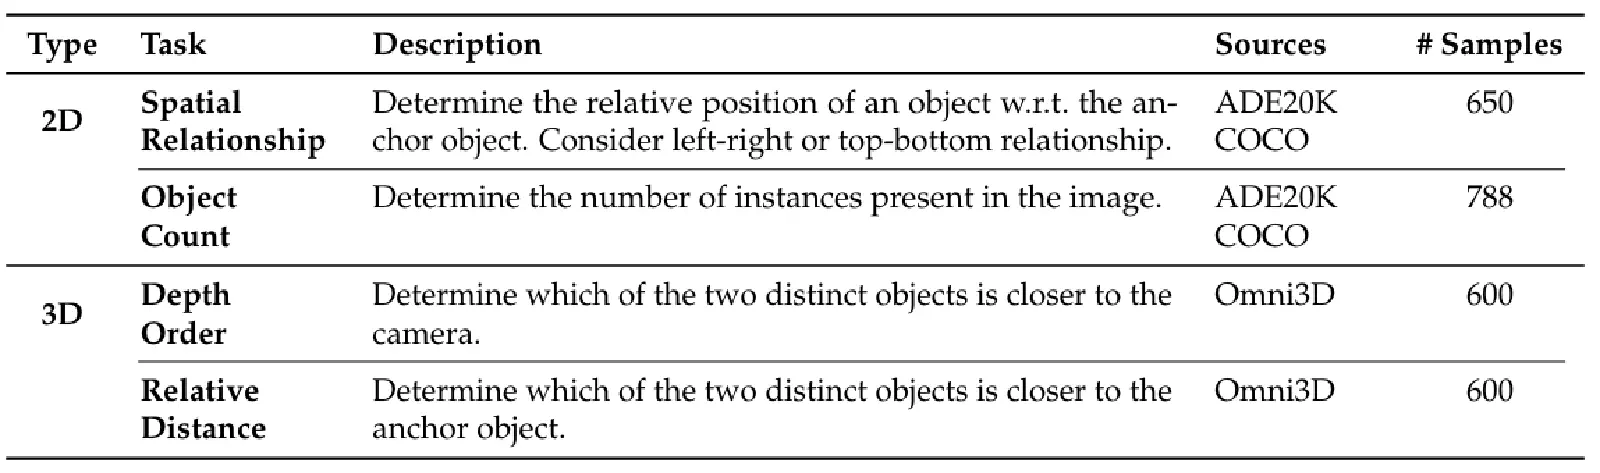
From Figure 4 and Table 1 above, we can see that CV-Bench measures a VLM’s 2D visual capabilities (Spatial Relationship and Object Count) and 3D visual capabilities (Depth Order and Relative Distance). Moreover, the authors put in considerable effort: every question in CV-Bench has been manually reviewed (according to their paper)!
5 Analysis 2: How Different Types of Visual Encoders Affect VLM’s Visual Capabilities
With a benchmark that can truly measure a VLM’s visual capabilities, the authors employed two-stage training to compare how different types of Visual Encoders affect VLM performance on various benchmarks. Two-stage training means:
- First Stage (Pre-Training Stage): The parameters of the VLM’s Visual Encoder and Large Language Model are frozen. The Connector is trained using Adapter Data.
- Second Stage (Fine-Tuning Stage): The parameters of the VLM’s Visual Encoder are frozen. The Connector and Large Language Model are trained using Instruction-Tuning Data.
In other words, in this two-stage training approach, the VLM’s Visual Encoder is always frozen!
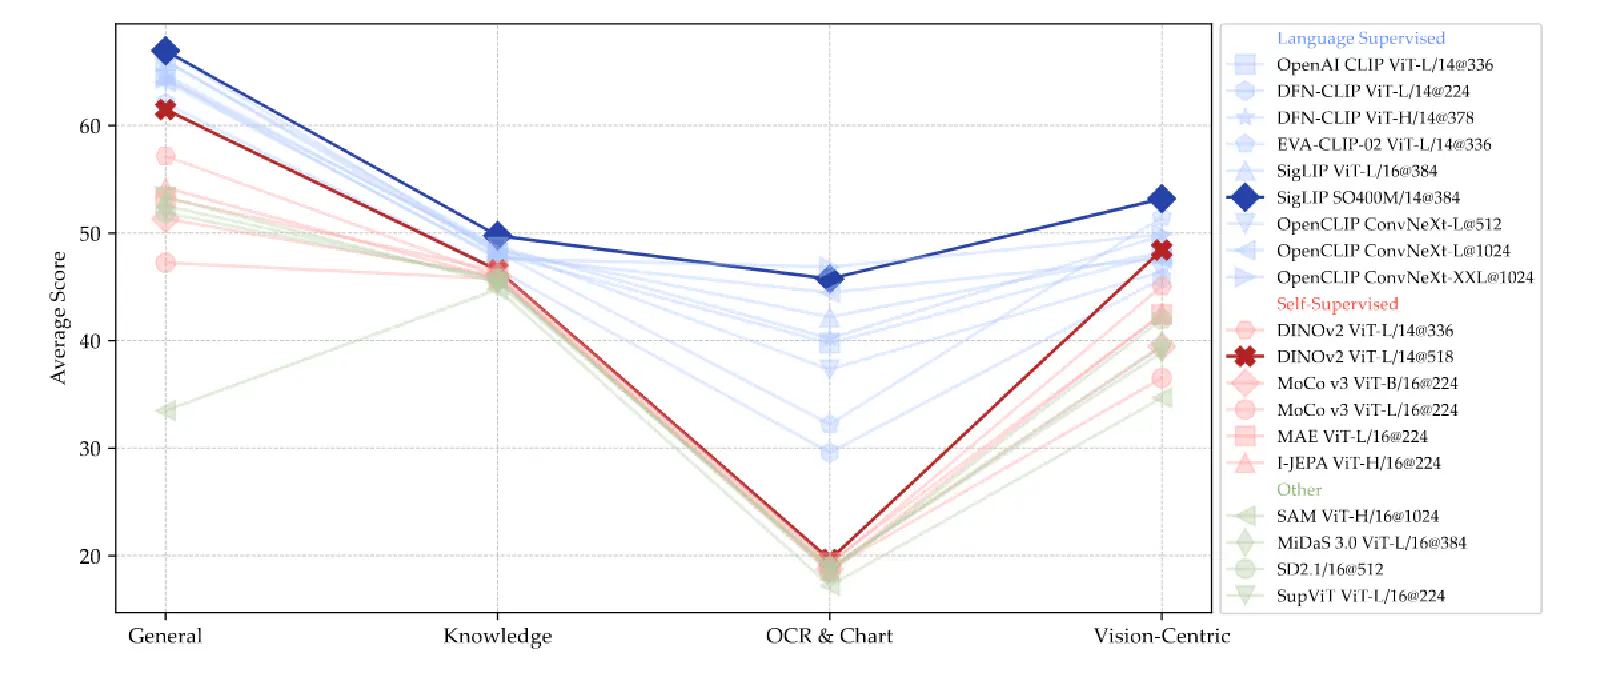
From Figure 6 above, it’s evident that Language-Supervised Models (e.g., CLIP) perform better than Self-Supervised Models (e.g., DINO), especially on chat and OCR-related questions.
This is mainly because CLIP-like Language-Supervised Models learn many image-text relationships during their training, making them better at understanding text within images (OCR-Related Tasks). In contrast, Self-Supervised Models only see image information during their training. The authors also mention that CLIP-based models might perform better because their training data is typically much larger than that of Self-Supervised Models.
Furthermore, for both Language-Supervised and Self-Supervised Visual Encoders, whether ViT-based or ConvNet-based, increasing image resolution improves VLM performance on vision-centric benchmarks. I noticed this finding aligns with the points made in Apple’s MM1 paper published in April 2024!
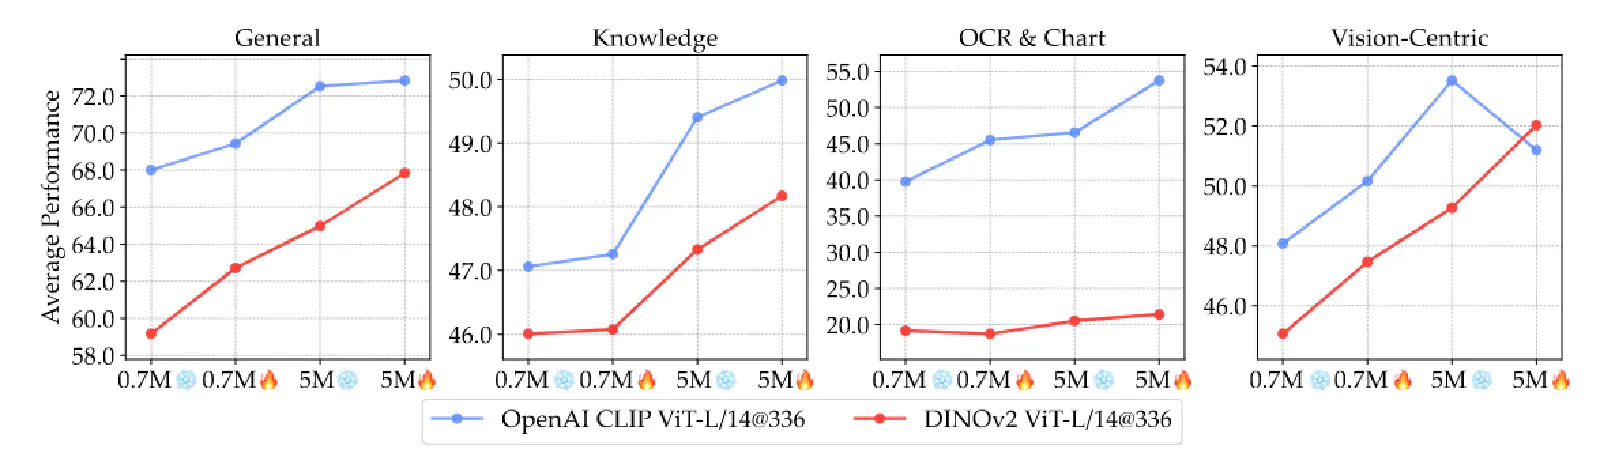
Although Language-Supervised Models (e.g., CLIP) generally outperform Self-Supervised Models (e.g., DINOv2) on VLM benchmarks, it was mentioned earlier that this could be due to the larger amount of training data used for CLIP.
Therefore, in Figure 7 above, the authors show that if DINOv2 (representing Self-Supervised Models) is used as the VLM’s Visual Encoder, unfreezing it during the Fine-Tuning Stage and using more Instruction Following Data can narrow the performance gap between DINOv2-based VLMs and CLIP-based VLMs.
The finding from this analysis is:
6 Analysis 3: VLM Training Methods — One Stage vs. Two Stage
After analyzing the impact of different Visual Encoders in VLMs, the authors then investigated how to effectively train VLMs. More specifically, is one-stage or two-stage training better for VLMs?
We’ve already introduced two-stage training, which involves pre-training the Connector and then fine-tuning the Connector and LLM. However, whether it’s truly necessary to pre-train the Connector is debatable, with some research suggesting alternative views.
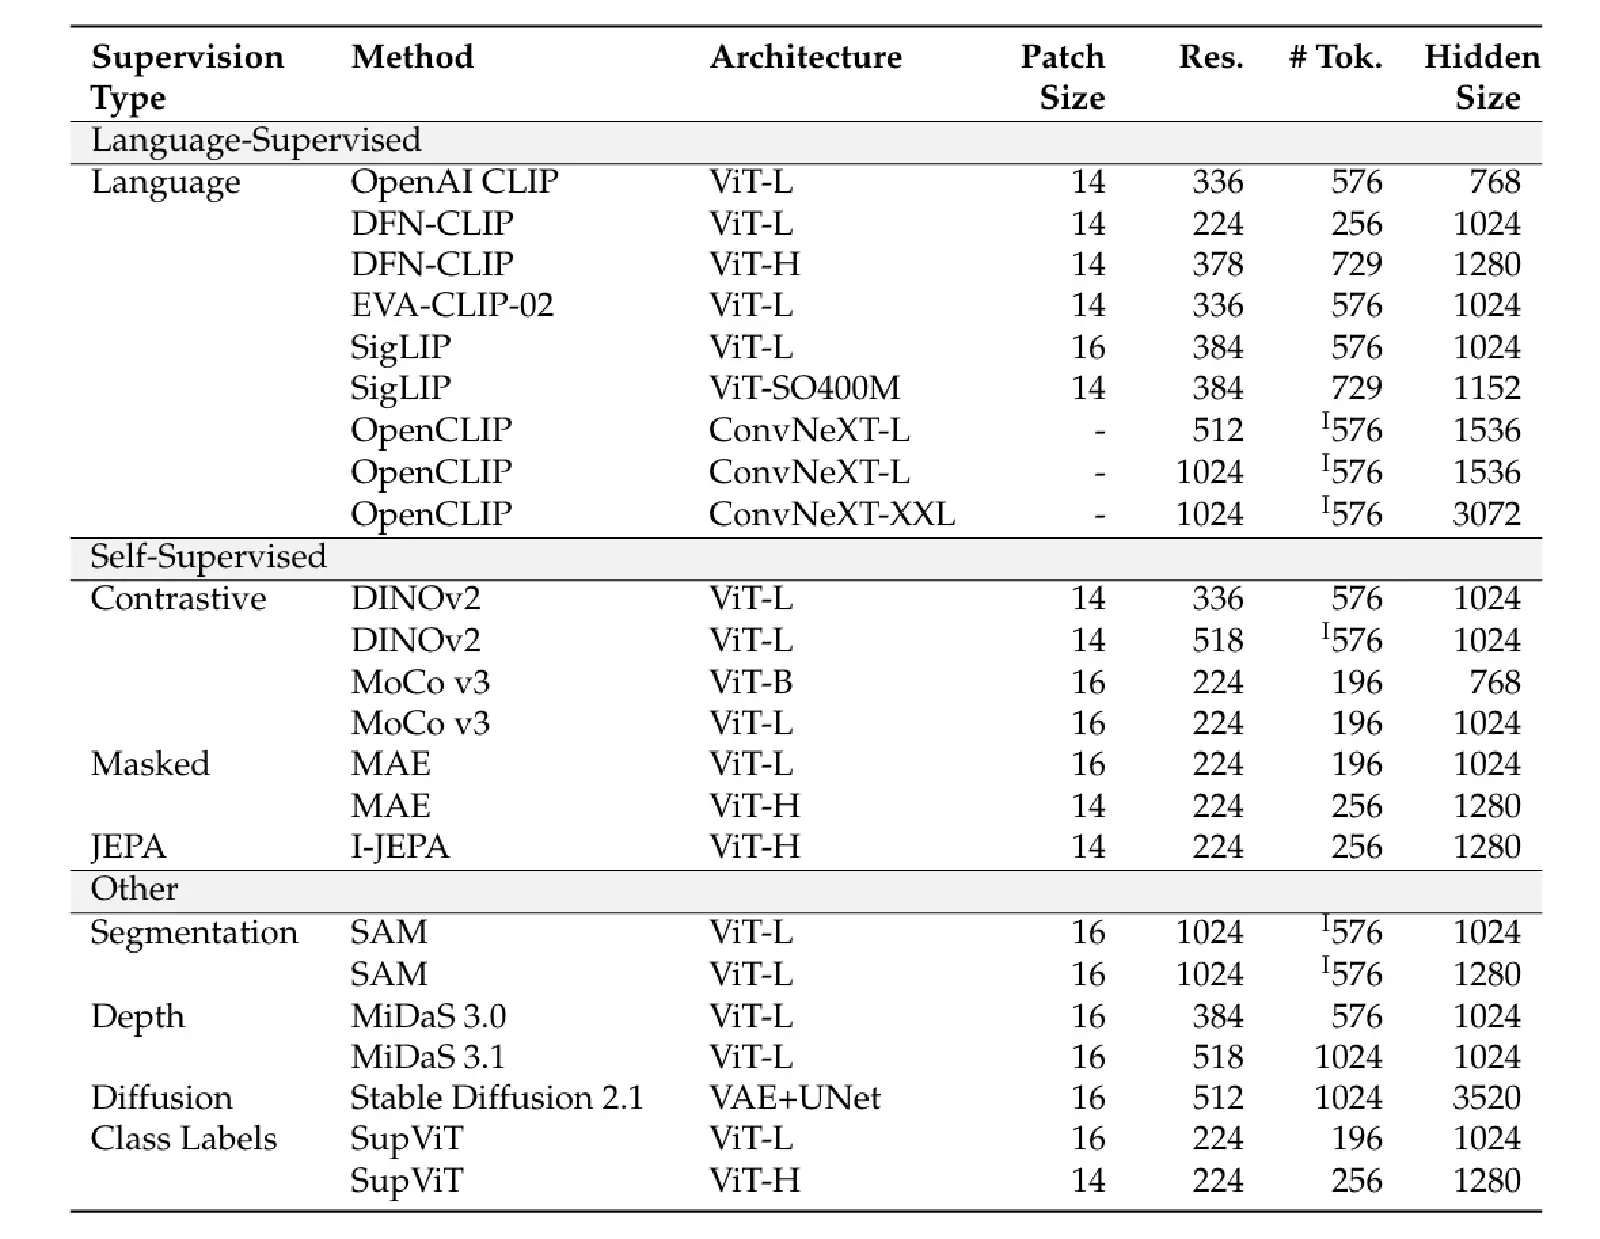
Therefore, one-stage training in this section means skipping the pre-training stage for the Connector and directly proceeding to the fine-tuning stage for the Connector and LLM. For these experiments, the authors used Vicuna-1.5-7B as the LLM backbone and combined it with the 23 Visual Encoders listed in Table 9 below:
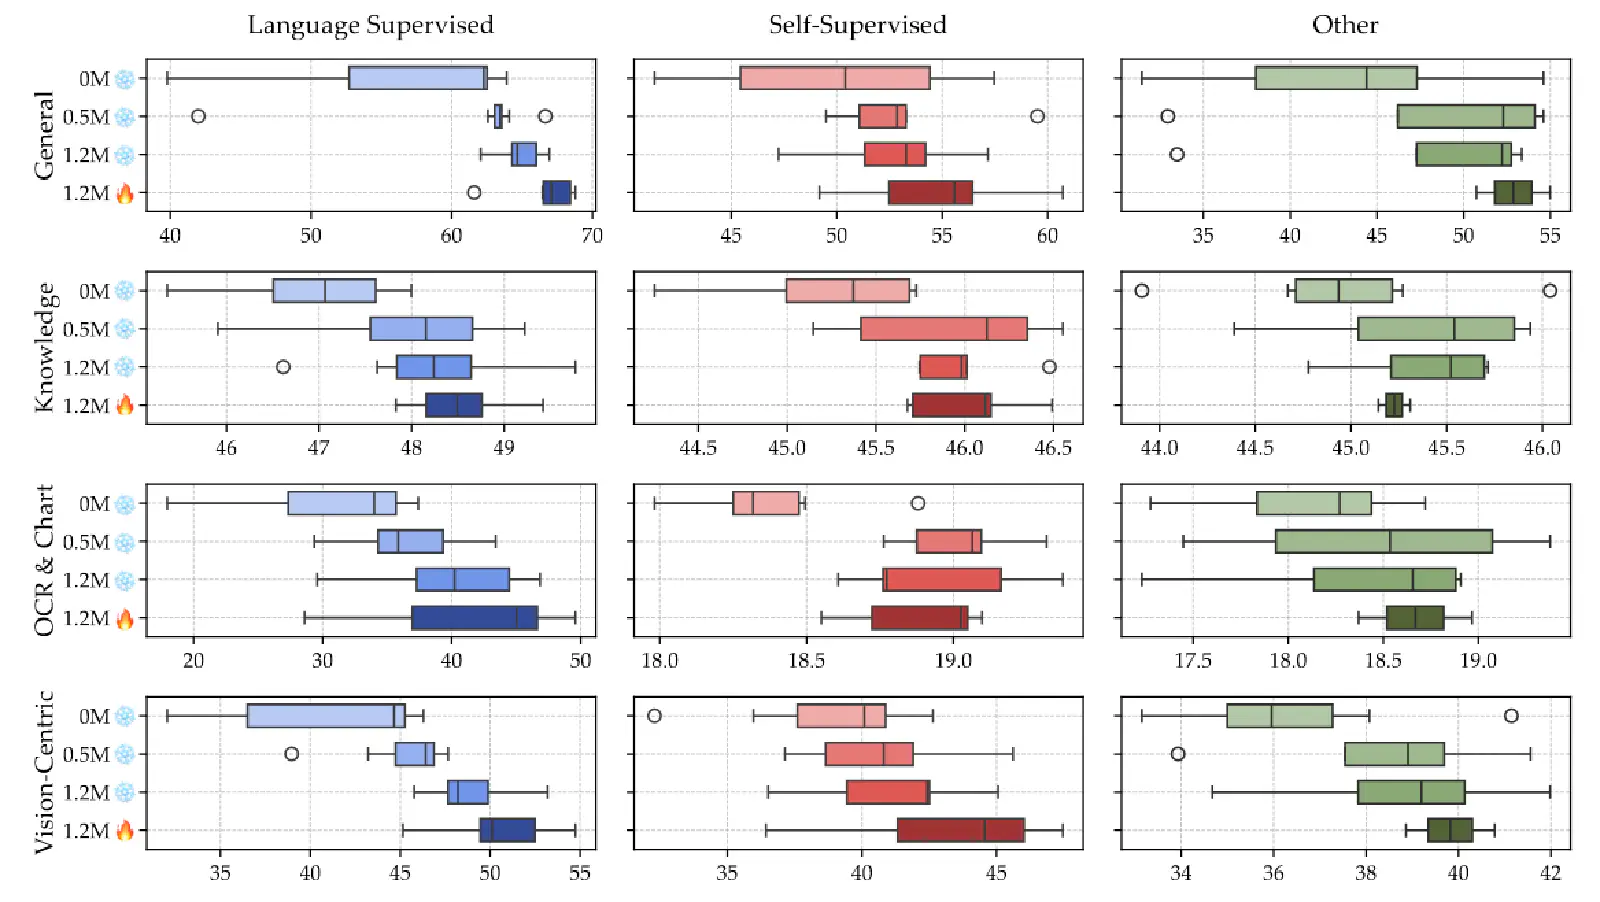
The experiments in Figure 5 above primarily show the performance of VLMs formed by 3 types of Visual Encoders (from Table 9) using 4 different training methods (0M_snowflake, 0.5M_snowflake, 1.2M_snowflake, 1.2M_flame) on benchmarks. The meaning of each training method is as follows:
- 0M_snowflake: In the Pre-Training stage, the Visual Encoder’s parameters are Frozen, and 0M Adapter Data is used to train the Connector. This is essentially one-stage training — no Pre-Training stage, directly proceeding to the Fine-Tuning stage.
- 0.5M_snowflake: In the Pre-Training stage, the Visual Encoder’s parameters are Frozen, and 0.5M Adapter Data is used to train the Connector. This is two-stage training.
- 1.2M_snowflake: In the Pre-Training stage, the Visual Encoder’s parameters are Frozen, and 1.2M Adapter Data is used to train the Connector. This is two-stage training.
- 1.2M_flame: In the Pre-Training stage, the Visual Encoder’s parameters are Unfrozen, and 1.2M Adapter Data is used to train the Connector. This is two-stage training.
From Figure 5, it’s clear that regardless of the Visual Encoder type and benchmark, the “0M_snowflake” training method performs relatively poorly compared to others, indicating that two-stage training indeed helps VLMs perform better.
Furthermore, in the Pre-Training stage, when the Visual Encoder’s parameters are Frozen (snowflake), using more Adapter Data (0M ⭢ 0.5M ⭢ 1.2M) leads to better VLM performance.
Finally, comparing “1.2M_snowflake” with “1.2M_flame” shows that the latter performs better, suggesting that unfreezing the Visual Encoder’s parameters during the Pre-Training stage can further enhance VLM performance!
The finding from this analysis is:
7 Analysis 4: Number of Visual Encoders in VLM — Single vs. Multiple
From the experiments in Figure 6, we see that different types of Visual Encoders (Language-Supervised, Self-Supervised, Other) exhibit varying performances on different benchmarks, suggesting they might excel at extracting different features from images. This led the authors to consider whether combining multiple Visual Encoders could capture a broader range of image features, thereby improving the VLM’s overall performance across all benchmarks.
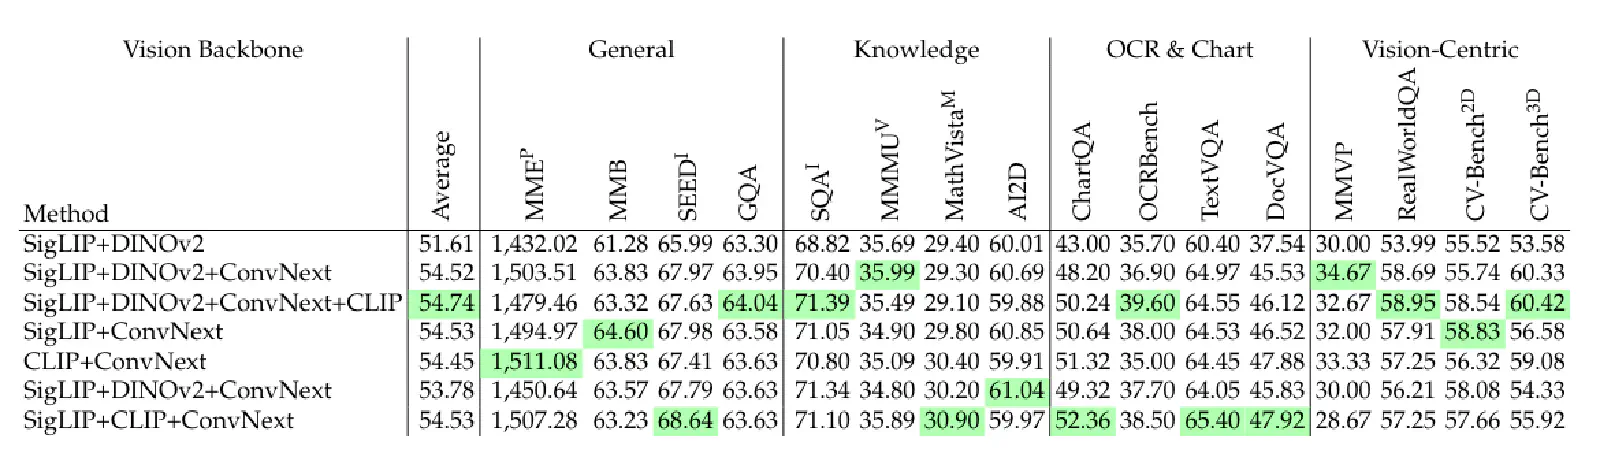
From Table 3 above, it’s evident that:
8 Analysis 5: New Connector Design in VLM — Spatial Vision Aggregator (SVA)
In the previous section (Analysis 4), we learned that combining information from multiple types of Visual Encoders can improve VLM performance. However, since each Visual Encoder may have different input image resolutions, their output token counts also vary.
To combine the outputs of these different Visual Encoders, the authors in the previous section (Analysis 4) took a naive approach: interpolating the output tokens of all Visual Encoders to 576 tokens each, and then concatenating these tokens along the feature dimension.
However, interpolation can cause information loss. Moreover, directly concatenating outputs from different Visual Encoders treats them with “equal” importance. Therefore, this section introduces the Connector designed by the authors to more efficiently aggregate outputs from multiple Visual Encoders, aiming to enhance the VLM’s visual capabilities.
I believe the Connector design proposed in this paper has a similar flavor to the Q-Former in BLIP-2: setting a fixed-size & learnable Query Token, and treating the Visual Encoder’s output tokens as Key Tokens and Value Tokens for a Cross-Attention operation. This allows the Query Token to attend to image information output by different Visual Encoders.
The benefits are clear: since the Query Tokens are learnable, the model can learn to extract information from multiple Visual Encoders, assigning different importance to their outputs. Additionally, because the Query Tokens are fixed-size, it avoids the problem of the concatenated tensor’s dimensionality increasing with the number of Visual Encoders.

Figure 8 (left) shows the Connector designed in this paper. The Connector has an L x L fixed-size & learnable Query Token Sequence (X). This sequence contains a total of L x L queries, each with C dimensions.
Additionally, Figure 8 (left) shows N Visual Encoders, each outputting J x J Visual Tokens. As mentioned earlier, to enable queries to obtain image feature information from different Visual Encoders, we need the queries to perform Cross-Attention with Visual Tokens (representing Keys and Values).
Interestingly, when performing Cross-Attention, the authors aim to preserve the original spatial relationships of image features. Thus, a Query Token only performs Cross-Attention with a specific set of Key/Value Tokens.
For example, the blue box in X (one Query Token) will only perform Cross-Attention with the red boxes in F (Key, Value Tokens). The position of the red boxes is calculated simply by determining how many times larger the output sequence of that Visual Encoder is compared to the Query Sequence.
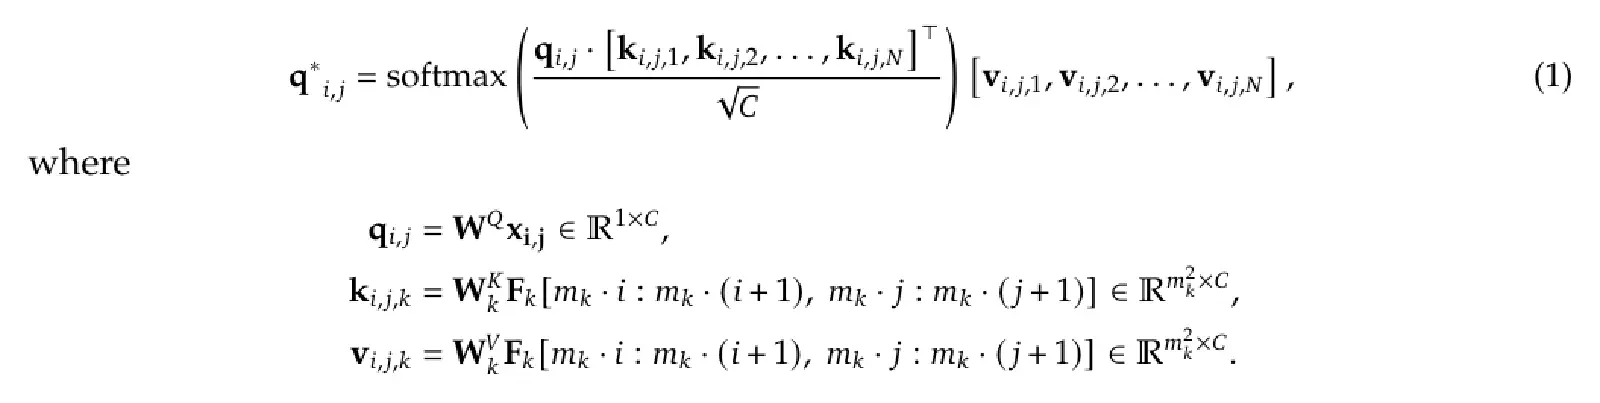
For instance, if the size of Fk is mk times that of X, then a Query Token at (i, j) in X will correspond to the following range of Visual Tokens (Key, Value Tokens) in Fk:

When Query and Key, Value perform Cross-Attention, the operation is as shown in Equation (1) below. X will have a Query Weight Matrix, and each Visual Encoder will have its own Key Weight Matrix and Value Weight Matrix to transform Visual Tokens into Keys and Values respectively:
So far, we have introduced the concept of the Spatial Vision Aggregator (SVA) proposed in this paper. However, it can be observed that one query in the Query Sequence actually needs to attend to many Visual Tokens.
In other words, a single Query Token needs to carry a relatively large amount of information. If the Cross-Attention operation described above is “performed only once,” it might also lead to the resulting Query Sequence being unable to digest all the information output by different Visual Encoders, causing loss of image information.
To solve this problem, as shown in Figure 8 (right), the authors placed this Connector not only at the beginning of the LLM but also within each layer of the LLM. This allows the Query Tokens to repeatedly perform Cross-Attention with the outputs of these Visual Encoders.
The finding from this analysis is:
9 Open Source 2: High-Quality Instruction-Tuning Data — Cambrian-7M
When we train an LLM to become a VLM, we fine-tune the LLM on vision-language instruction-following data. However, this can lead to a decrease in the LLM’s conversational abilities (a phenomenon known as Catastrophic Forgetting). A common practice is to include some language-only instruction-following data in the instruction-following dataset.
This paper collected all publicly available instruction-tuning datasets, used some data engine & prompting methods to obtain more vision question-answer samples, and then compiled the Cambrian-10M dataset. Finally, through some data curation methods, they obtained high-quality instruction-tuning data — Cambrian-7M.
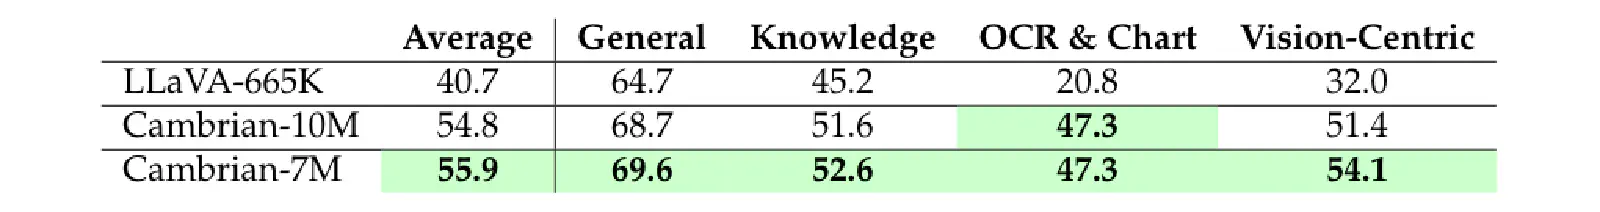
Table 7 above shows the performance difference on benchmarks when a VLM is trained on Cambrian-7M versus LLaVA-665K.
10 Analysis 6: Controlling VLM Output Content via System Prompts
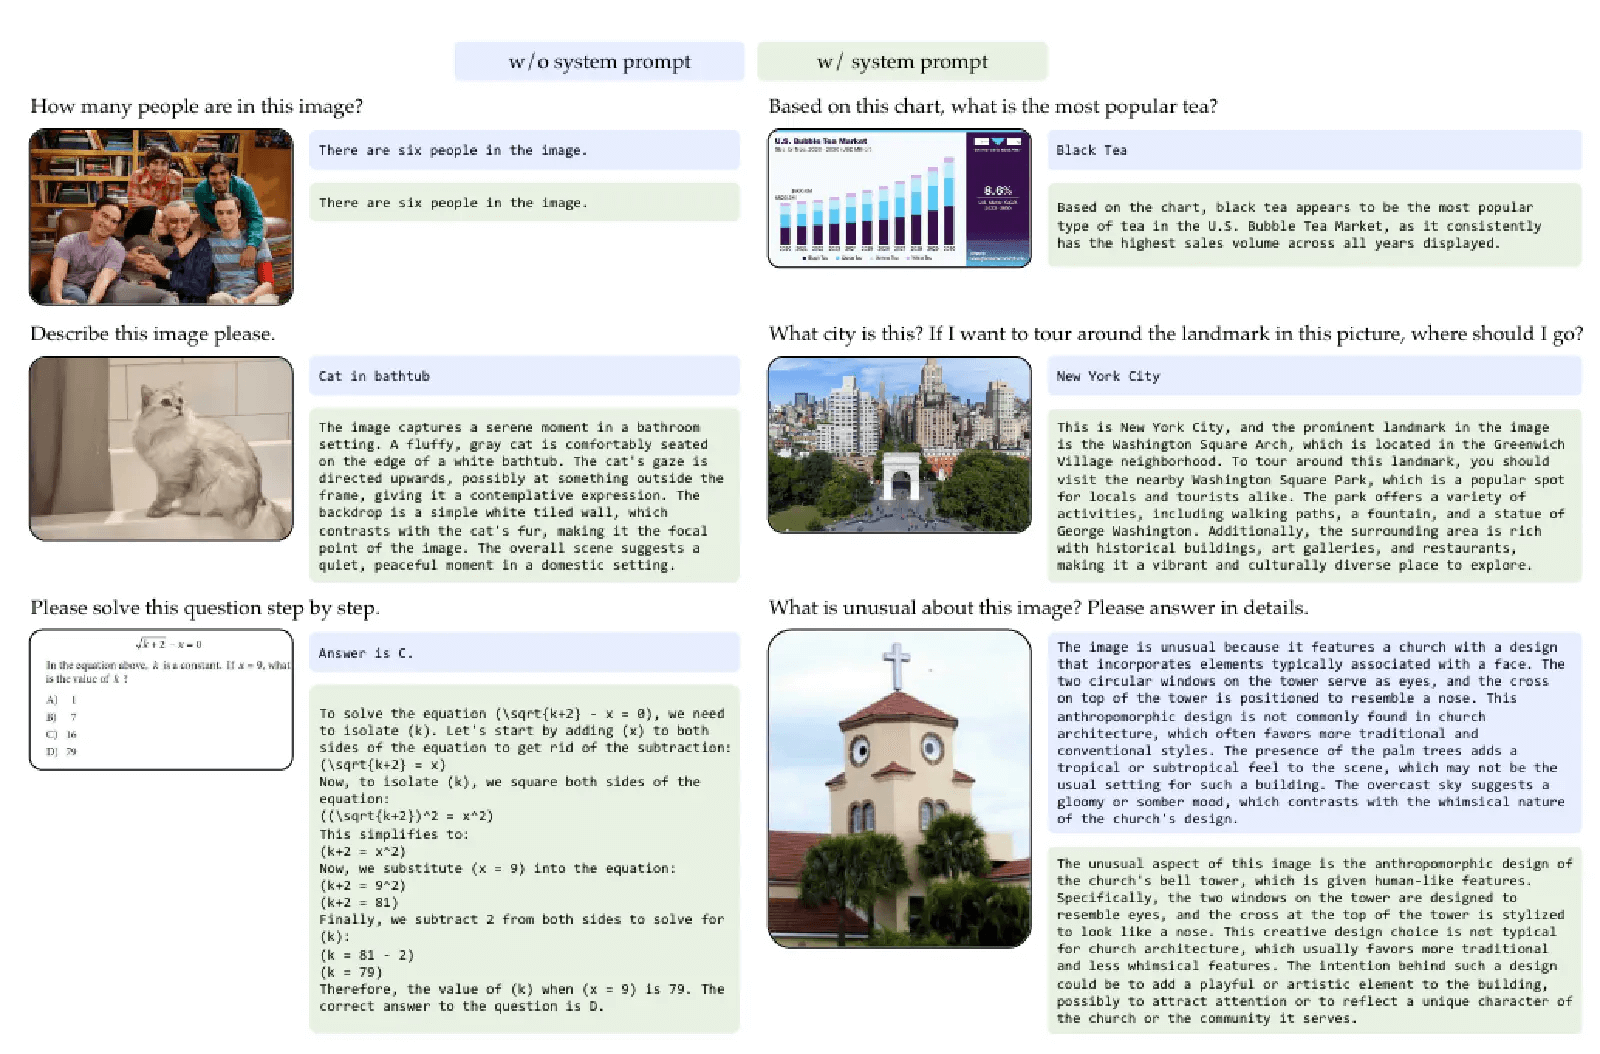
The authors found that after successfully training an LLM into a VLM through two-stage training, the VLM tends to become an “Answer Machine.” As shown in Figure 12 (w/o system prompt) below, when a question is input into the VLM, it outputs a short, direct answer:
This situation arises mainly because the instruction-following dataset (Cambrian-7M) used in the VLM’s fine-tuning stage contains many visual question-answer samples.
Many of these samples have relatively short answers, causing the VLM to learn to answer visual questions concisely. To address this, the authors added “System Prompts” to each dataset within the instruction-following dataset (Cambrian-7M).
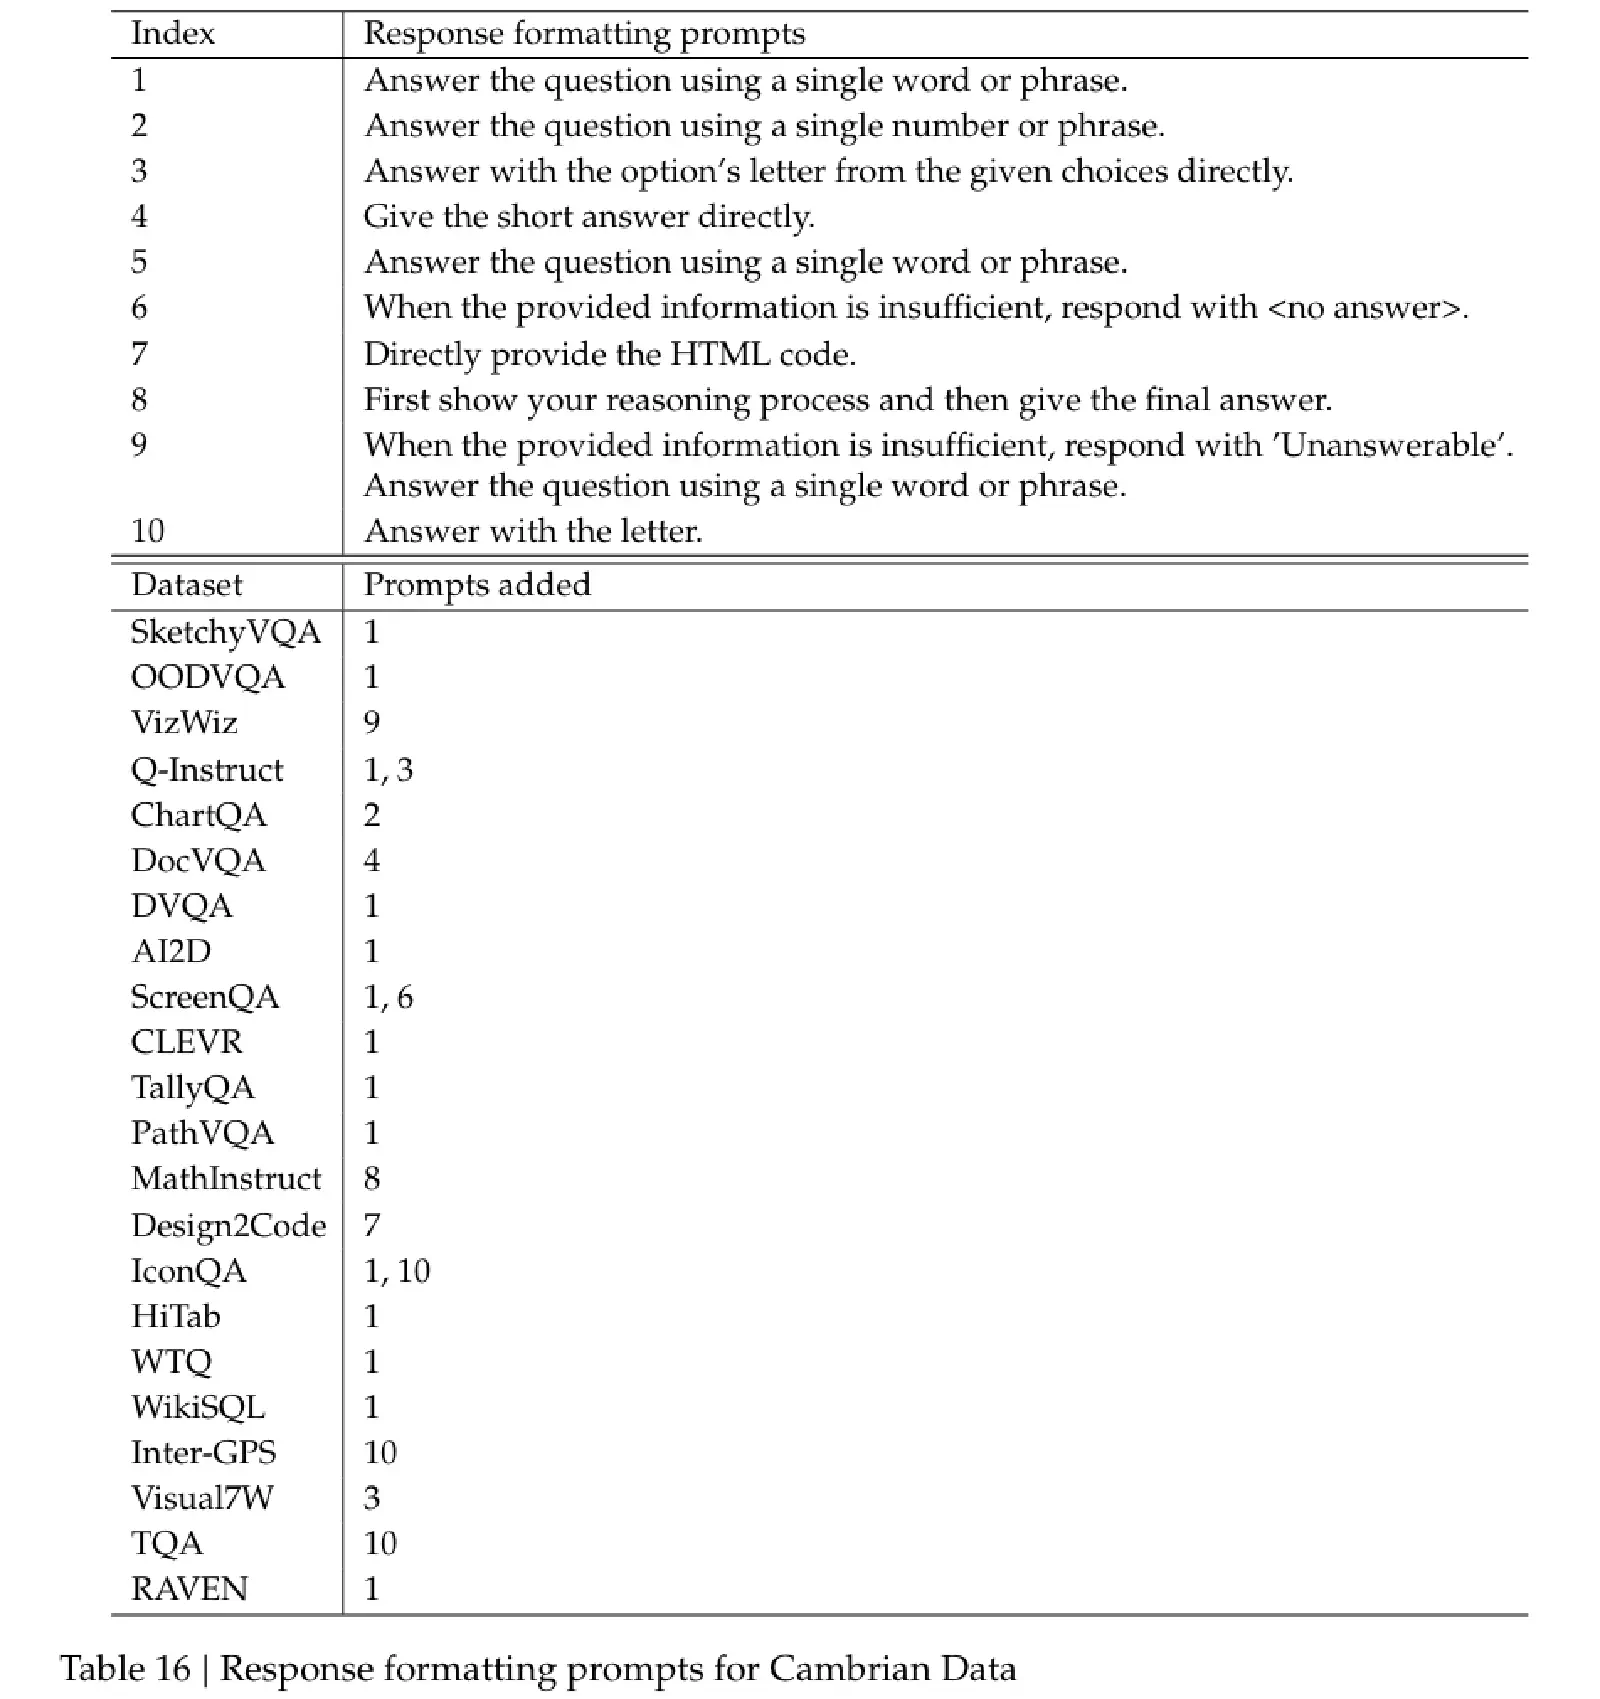
For example, if a training sample’s answer is very short, a System Prompt like “Answer the question using a single word or phrase” would be added. This teaches the VLM to modify its output based on the System Prompt.
Table 16 below shows the System Prompt corresponding to each dataset:
As shown in the example in Figure 12 (w/ system prompt) above, training the VLM with an instruction-following dataset that includes appropriate System Prompts helps the VLM adjust its output during inference based on the System Prompt. The finding from this analysis is:
11 Open Source 3: Vision-Language Model — Cambrian-1
Finally, leveraging all the preceding analyses, the authors trained a brand new VLM — Cambrian-1. Cambrian-1 comes in different scales based on different LLMs (8B, 13B, 34B).
Cambrian-1 integrates four different Visual Encoders using its designed Connector (SVA). For training, Cambrian-1 adopts a two-stage approach, using 2.5M Adapter Data in the Pre-Training stage and their self-created Cambrian-7M in the Fine-Tuning stage.
Table 8 below shows Cambrian-1’s impressive performance: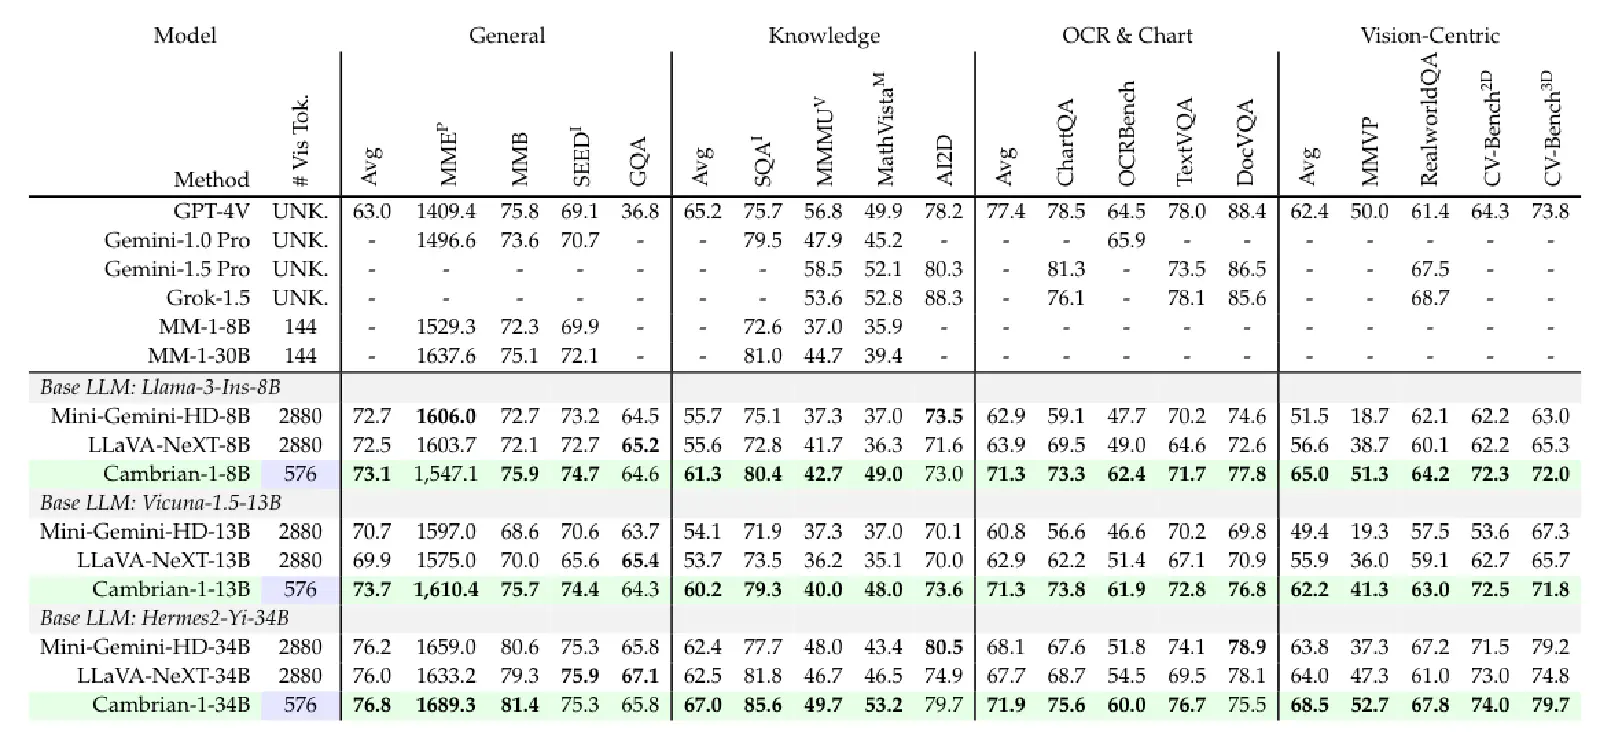
12 Conclusion
In this article, we shared insights from the paper Cambrian-1: A Fully Open, Vision-Centric Exploration of Multimodal LLMs. The authors, from a “visual capability” perspective, analyzed various design aspects of VLMs, including benchmarks, Visual Encoders, Connectors, training recipes, and instruction-following data, to understand how these variables affect a VLM’s visual prowess. After reading this, you’re likely as impressed as I am by the thoroughness of the authors’ VLM research, and I hope you’ve gained valuable insights too!
Here are the key takeaways from this paper:
- Most current VLM benchmarks do not genuinely measure a VLM’s “visual capabilities” but overly focus on “language capabilities.” Therefore, this paper also created and open-sourced a vision-centric benchmark ( CV-Bench) to measure VLM visual abilities.
- Language-Supervised Models (e.g., CLIP) are better at understanding text in images, thus performing better on OCR-related tasks than Self-Supervised Models (e.g., DINO).
- Regardless of the Visual Encoder type, increasing image resolution positively impacts VLM performance.
- Pre-training the Connector before fine-tuning the Connector and LLM in a VLM indeed improves performance.
- Using more training data (Adapter Data) during the pre-training stage also boosts VLM performance.
- During the pre-training stage, including the Visual Encoder in training (unfreezing it) alongside the Connector can further enhance VLM performance.
- Combining more diverse types of Visual Encoders in a VLM can enhance its visual capabilities and lead to better benchmark performance.
- When designing VLM connectors, considering the spatial information of image features to integrate outputs from multiple Visual Encoders, and infusing image information throughout the LLM (not just before it) helps enhance the VLM’s visual capabilities.
- Providing appropriate system prompts based on the answer length of VQA samples in the instruction-following dataset helps the VLM learn to adjust its output via system prompts.
- The authors have open-sourced the following datasets and models:
- CV-Bench: A vision-centric benchmark for measuring VLM visual capabilities.
- Cambrian-7M: High-quality instruction-tuning data.
- Cambrian-1: A state-of-the-art Vision-Language Model.