Is Bash All You Need? A Shell Beats Typed Tools

1 Give an agent only a shell, and it scores higher
How should you equip an enterprise AI agent to work in GitLab, a chat app or a spreadsheet? Intuition says a set of purpose-built tools should be steadier and safer than handing it a bare command line. This paper puts five ways of doing it through one controlled comparison, and the result goes the other way: an agent with only a bash shell scored higher on two enterprise-work benchmarks, and used fewer tokens (the units a model reads and writes, and is billed by). Adding purpose-built tools on top of the shell, or letting the agent build its own, showed no detectable score gain.
What the paper compares is the tool interface: how the agent acts on its environment. At one end is the typed tool, a function defined in advance with a fixed name and parameter format, such as gitlab_create_issue, which the model calls one at a time. At the other end is a bash shell (a command line) where the model writes its own commands. There are compromises in between; the paper compares five interfaces in all. Both ends are used in practice, but controlled head-to-head evidence is scarce.
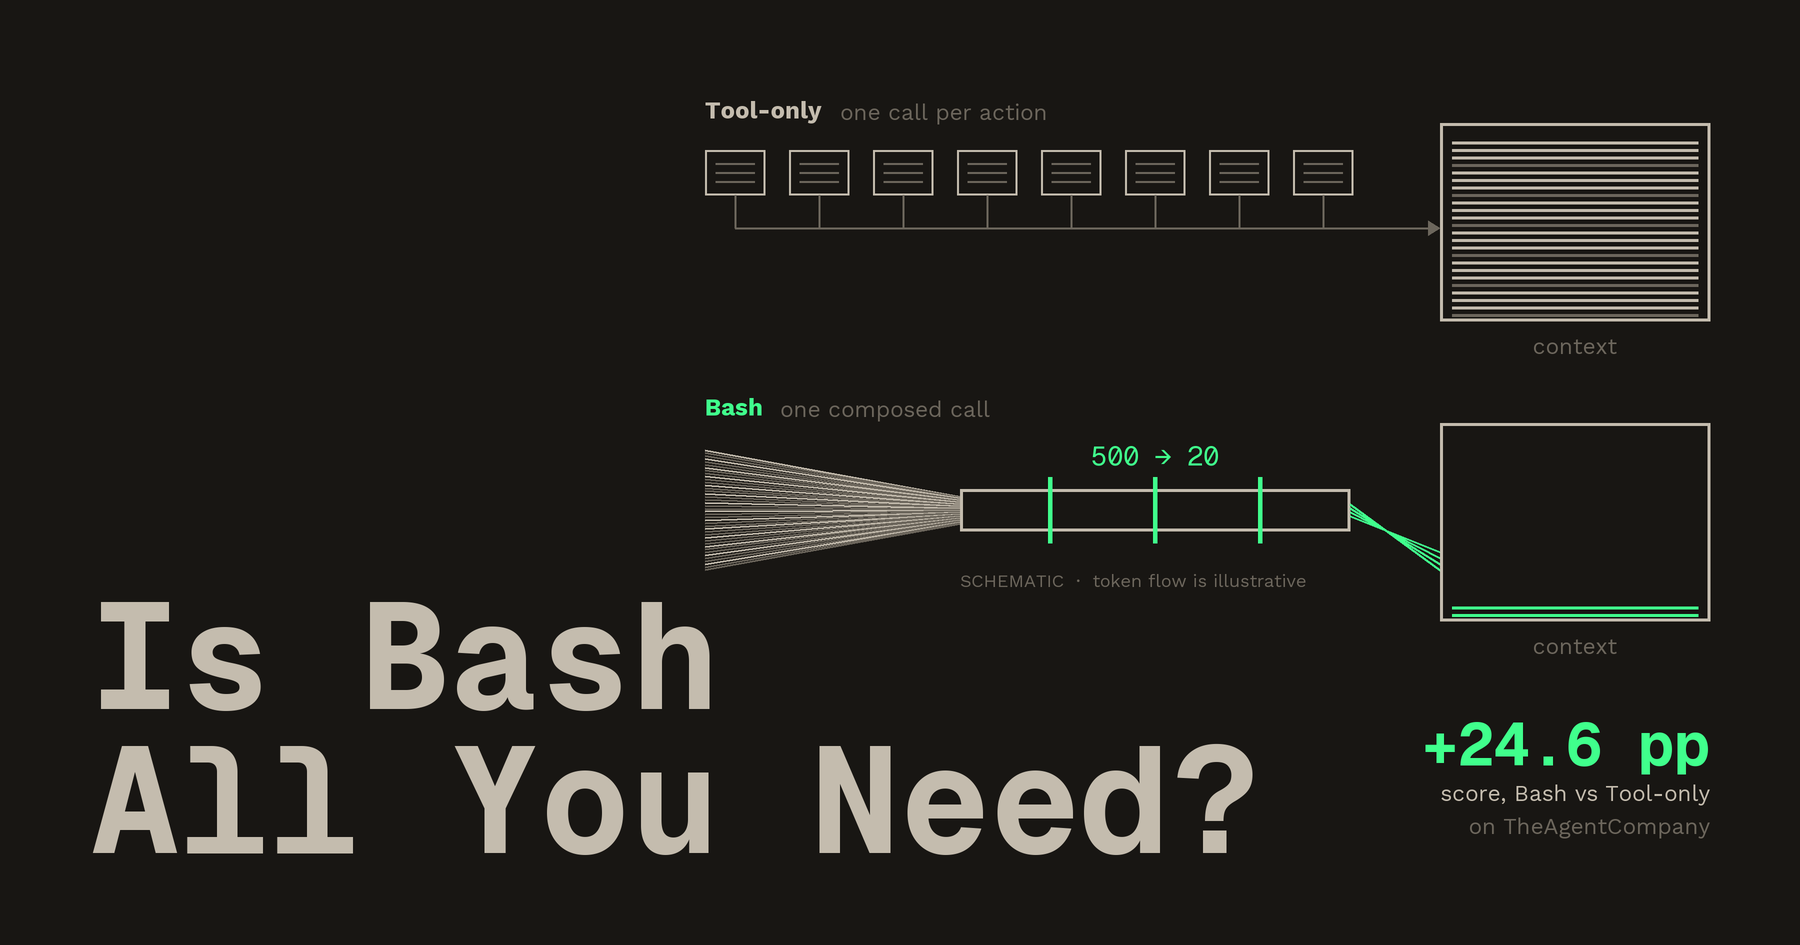
How big is the gap? Compared with typed tools only, Bash scored 21.8 to 24.5 percentage points (pp) higher on TheAgentCompany (a benchmark that simulates a software company) and 4.8 to 7.4 pp higher on APEX-Agents (a benchmark that simulates professional analysis in investment banking, consulting and corporate law), with 19% to 72% fewer total tokens per task. The scores are themselves percentages, so the gaps are in percentage points; the ranges come from subtracting cell by cell in the paper’s full results table.
One of the compromises is PTC (Programmatic Tool Calling): the model writes a short program, and that program can only call the predefined tools. It used fewer tokens than typed tools alone, scored about the same, and lost to Bash overall.
The paper’s practical advice is conditional: if you can isolate arbitrary code execution, use Bash; if compliance limits you to a fixed tool catalog, use PTC.
Paper: Is Bash All You Need? An Empirical Study of Tool Interfaces for Enterprise Digital Worker Agents (Microsoft, CMU; arXiv 2609.11999v1, 2026-09-10). The paper proposes no new method; its value is putting five interfaces into one controlled setting.
2 How should an enterprise agent get its tools? Two paths, two costs
An agent is a system that has a large language model (LLM) loop through “think → call a tool → read the result” until the task is done, rereading the whole conversation so far on every turn. The tool interface it gets decides what it can do, how safe it is and how much it costs; the paper measures “how much” by token counts and estimated dollar cost. The APEX-Agents environment below serves its applications through MCP servers: MCP (Model Context Protocol) is a standard way to wrap outside services as tools a model can call (general knowledge, not from the paper).
- Coding already has precedents: among coding agents, mini-SWE-agent gets only bash, while Live-SWE-agent builds its own tools and once topped SWE-bench Verified (a leaderboard for coding agents).
- Enterprise products follow both paths: the Anthropic and OpenAI APIs offer PTC (limited to a fixed tool catalog); Claude Code, Codex CLI and Microsoft Copilot Studio (built on GitHub Copilot CLI) take the shell route.
- The gap: enterprise work means switching between applications, talking to coworkers and doing professional analysis, which is unlike writing code, and controlled shell-versus-typed-tools comparisons in this setting are rare, so practitioners have no evidence to choose by. A concurrent paper, Patel et al. 2026 (The Bitter Lesson of Tool Calling), compared PTC with ordinary JSON tool calling but left the shell out.
Each side has a cost:
| Shell | Typed tools | |
|---|---|---|
| Benefit | One step can do many actions | Exposes only authorized functions; safe and controllable |
| Cost | Arbitrary execution needs control over the environment and access scope | Every action is its own call, and the overhead adds up |
The three questions below are my framing, assembled from the paper’s Introduction and Method; the results follow them:
- Q1: Can a shell alone beat typed tools alone?
- Q2: Does adding typed tools on top of the shell, or letting the agent build reusable tools, help further?
- Q3: How does PTC, the compromise, perform?
3 A fair test: same model, same tasks, only the agent’s hands change
The authors keep the model, the task text, the base prompt and the stopping rule the same, and change only how the agent can act, to isolate the effect of the interface itself. The models tested are Opus-4.8 and GPT-5.5 at their default reasoning effort. The agent loop comes from the GitHub Copilot SDK, with its default tool set and system prompt replaced (the paper’s Appendix A).
3.1 The five tool interfaces
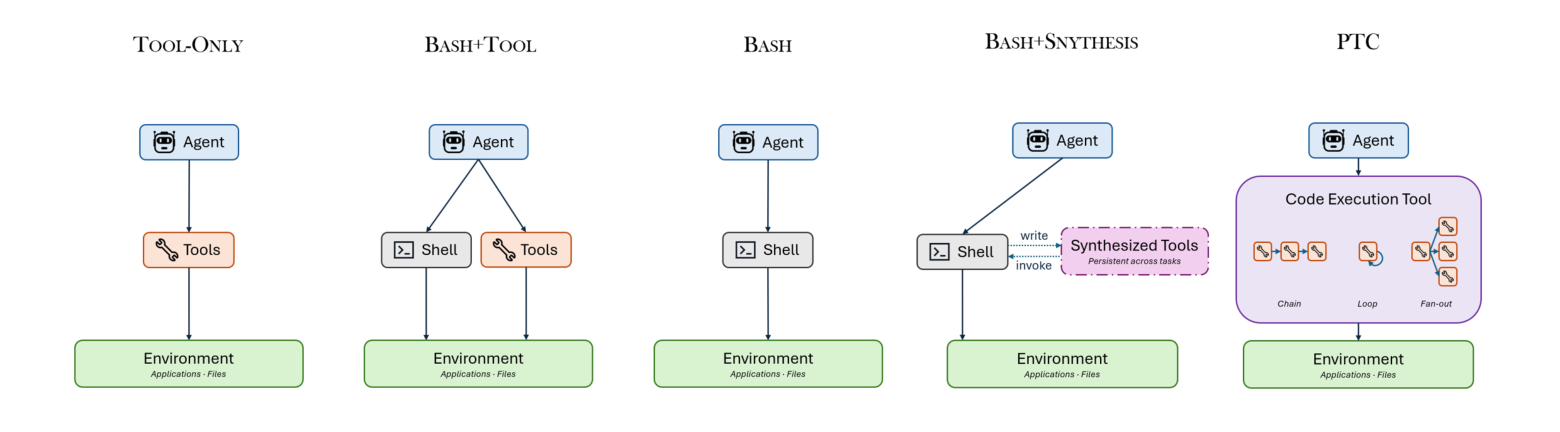
The figure below shows how the five interfaces are built from shell execution, typed tools, persistent self-made tools, and restricted programs that can only call typed tools.
| Interface | What the agent has | What is special |
|---|---|---|
| Tool-only | Typed tools only | Every action is a separate call; this is the baseline. Exposes only authorized functions, so it is safe and controllable |
| Bash | A shell only | Can chain several actions into one call with a pipe (\|, which feeds one command’s output into the next) and loops; maximum flexibility, but arbitrary execution needs separate isolation and access control |
| Bash+Tool | A shell plus typed tools | Both available; the agent picks |
| Bash+Synthesis | A shell plus a persistent folder | The prompt encourages the agent to turn common steps into reusable scripts that later tasks call directly, to cut the cost of rediscovery; tasks run in sequence and the folder persists |
| PTC | The model writes Python that can only call typed tools | In between: keeps a fixed tool catalog but can still loop, chain and batch in parallel; it has no shell and no other way to touch the environment |
Only Bash+Synthesis and PTC get extra interface-specific prompt instructions; the others share the same base prompt.
3.2 One task, three interfaces
A made-up example shows the difference between three of the interfaces. The task: list the titles of open issues in a GitLab project whose titles contain “bug”. Suppose the project has 500 open issues and 20 of them match. Watch how much data each approach sends back into the model’s context (all the text the model reads on each turn, including every earlier tool result).
[Tool-only]
 turn 1: call gitlab_list_issues(project="p", state="opened")
         -> the full content of all 500 issues lands in the model's context
 turn 2: the model picks the matching titles out of those 500 and writes the answer

[Bash]
 turn 1: bash("curl -s $GITLAB/api/.../issues?state=opened | jq -r '.[].title' | grep -i bug")
         -> only 20 lines of titles land in the context

[PTC]
 turn 1: the model sends a Python snippet:
         issues = gitlab_list_issues(project="p", state="opened")   # 500 issues, kept inside the program
         hits = [i["title"] for i in issues if "bug" in i["title"].lower()]
         print(hits)                                              # only 20 titles go back to the model
What PTC and Bash have in common here: intermediate results stay outside the model, and only the cleaned-up output comes back. The paper attributes PTC’s token savings to this mechanism, but hedges ("These savings may reflect…"); it is the authors’ conjecture and was not tested directly. The going-deeper section at the end works through why this saves tokens.
Keep this example in mind: 500 records versus 20 lines. We will come back to it whenever Bash and PTC save tokens.
3.3 Two enterprise benchmarks, with typed tools from different sources
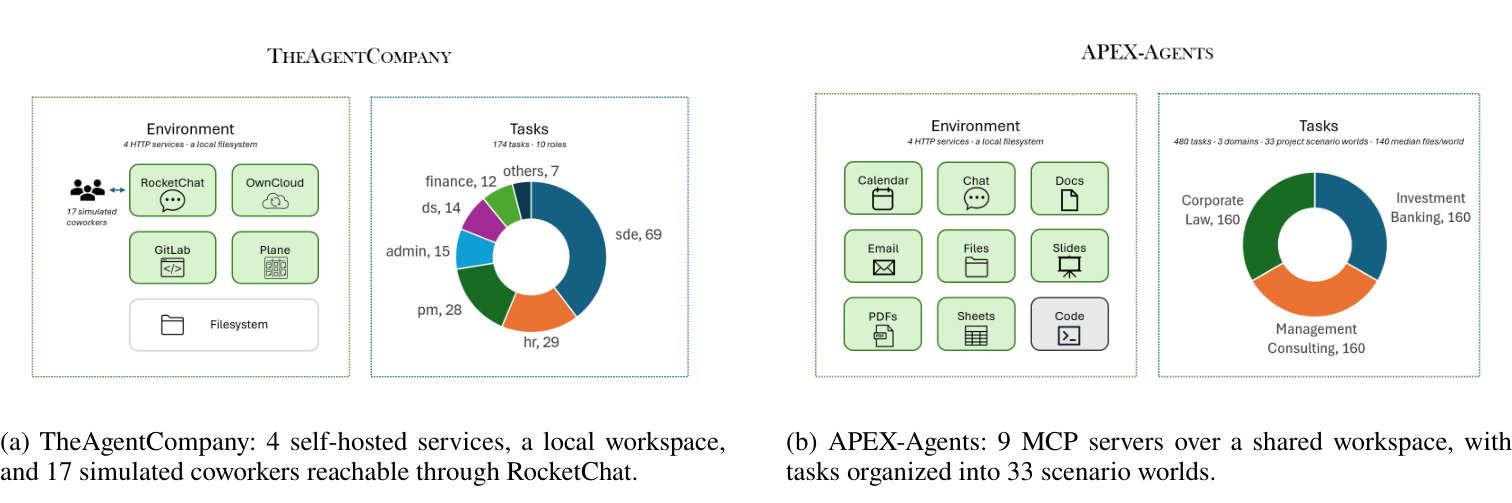
The two benchmark environments are shown below: TheAgentCompany has 4 self-hosted services, a local workspace, and 17 simulated coworkers reached through RocketChat; APEX-Agents has 9 MCP servers sharing one workspace, with tasks spread across 33 scenario worlds.
| TheAgentCompany | APEX-Agents | |
|---|---|---|
| Simulates | A software company: work across GitLab, RocketChat (chat), ownCloud (cloud drive) and Plane (project management), plus local files | Professional analysis in investment banking, management consulting and corporate law: contract review, spreadsheet valuation, survey consolidation |
| Tasks | 174 (software engineering 69, HR 29, project management 28, admin 15, data science 14, finance 12, other 7) | 480, 160 in each of three domains, spread across 33 scenario worlds |
| Coworkers | 17 simulated coworkers played by GPT-5, reached through chat | None |
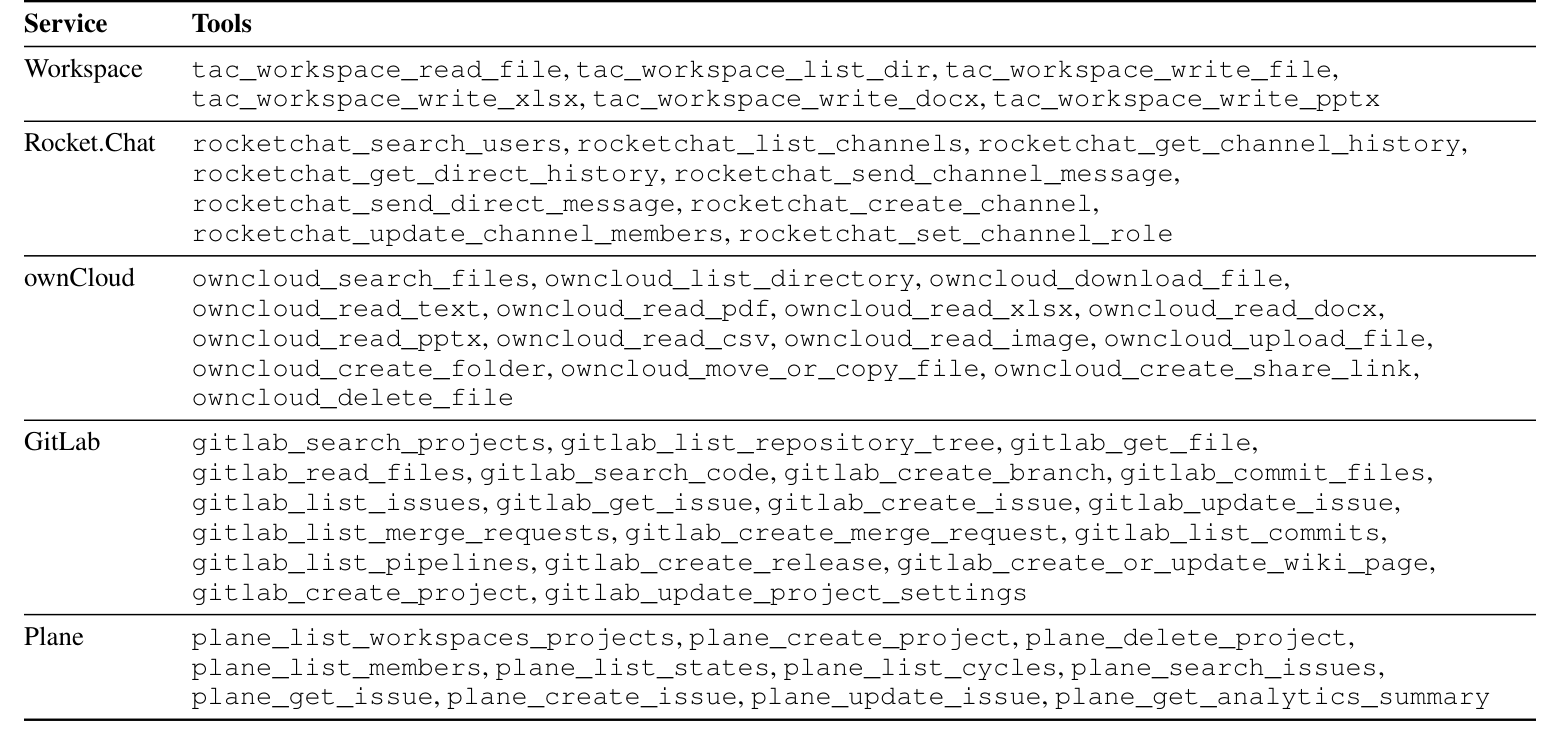
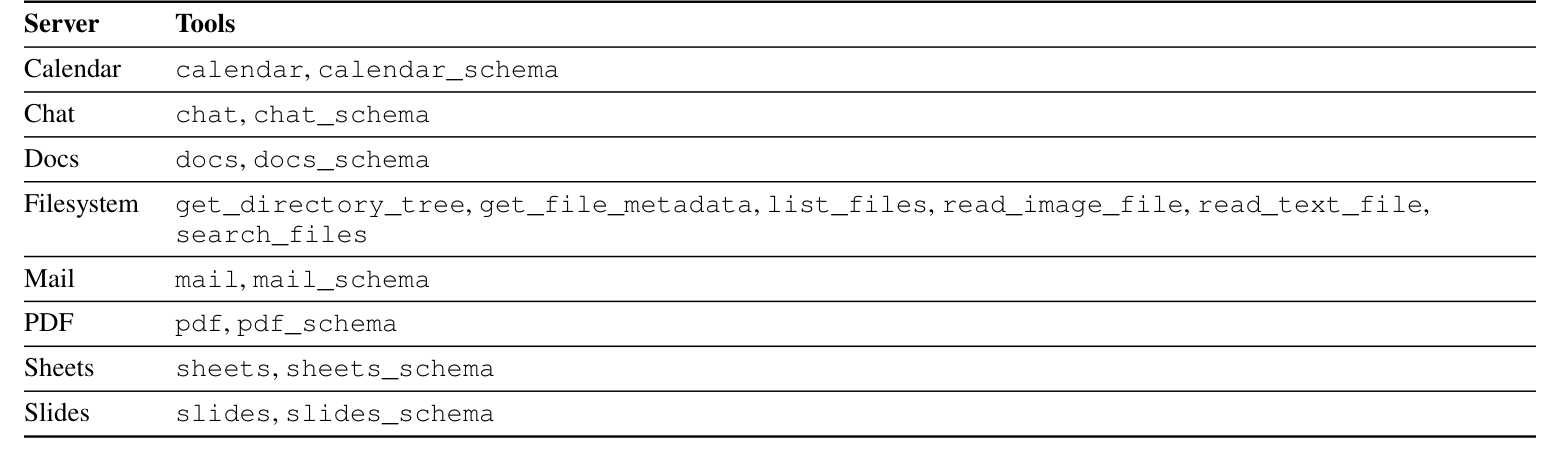
| Where the typed tools come from | The benchmark has none, so the paper’s authors designed 60 (54 service tools plus 6 workspace file tools) | The benchmark’s own 20, spread over 8 non-shell servers |
| Where Bash comes from | A shell, given directly | The benchmark’s code-execution server: a Unix shell with file-system limits, a cleared environment and execution caps |
| Grading | A Python checkpoint program per task | An LLM judge checks the final reply and workspace file changes item by item against a rubric (a scoring guide) |
| Environment version | Reliability bugs in the coworker simulation (dropped messages, early exits, stale state) were patched, for every interface alike | Pinned to the 2026-06 environment snapshot (Archipelago, 9 MCP servers), avoiding the paid financial-data APIs of newer versions |
The paper lists both tool sets in its appendix. TheAgentCompany’s 60, grouped by service:
APEX-Agents’ 20 tools come with the benchmark. Apart from the file-system server, each server pairs one “action-dispatch tool” with one “schema tool”.
3.4 Agents game the grader: Bash’s scores come with extra guardrails
One more detail: these absolute scores cannot be compared with public leaderboards. The official APEX-Agents leaderboard uses maximum reasoning effort and a newer server snapshot; this study uses default reasoning effort and the older snapshot (Appendix B.2).
3.5 How the scoring works: score, pass rate, tokens and paired gaps
The tables that follow use these metrics:
| Metric | Definition | What it measures |
|---|---|---|
| Score | TheAgentCompany: checkpoint pass rate weighted by effort; APEX-Agents: mean share of rubric items satisfied | How much of the task got done. The two benchmarks compute it differently, so they cannot be compared directly |
| Pass rate | Share of tasks fully solved (every checkpoint or every rubric item met) | How completely tasks were finished |
| Total tokens | Mean input plus output tokens per task (input includes cache reads, the repeated prefix that is billed at a lower rate) | How much text was read and written |
| Cost per task | Estimated inference cost per task (US dollars) at GitHub Copilot list prices | How much money it took |
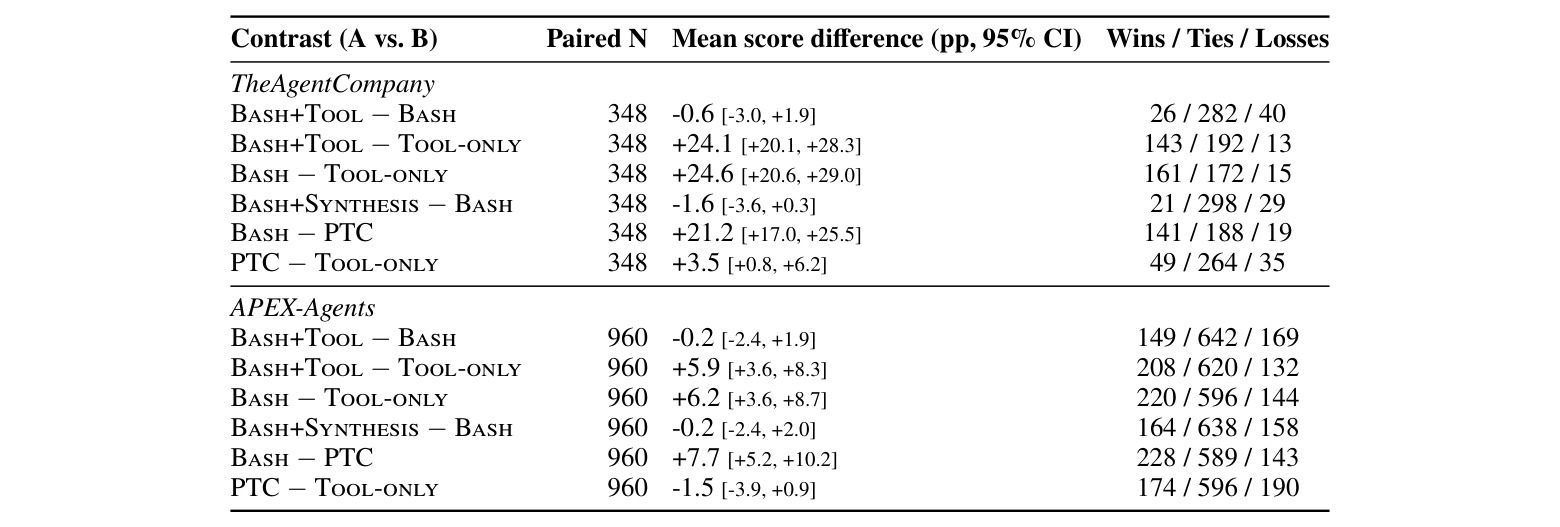
| Paired score gap (pp) | For the same task and model, subtract one interface’s score from the other’s, then average over tasks | The net gap between two interfaces; pp means percentage points |
| 95% bootstrap confidence interval | Resample the paired tasks repeatedly, recompute the mean gap, and see how spread out the results are; for now, read it as “roughly the range this gap falls in” | How uncertain the gap is; details in a going-deeper section at the end |
4 Bash versus Tool-only: all four settings point the same way
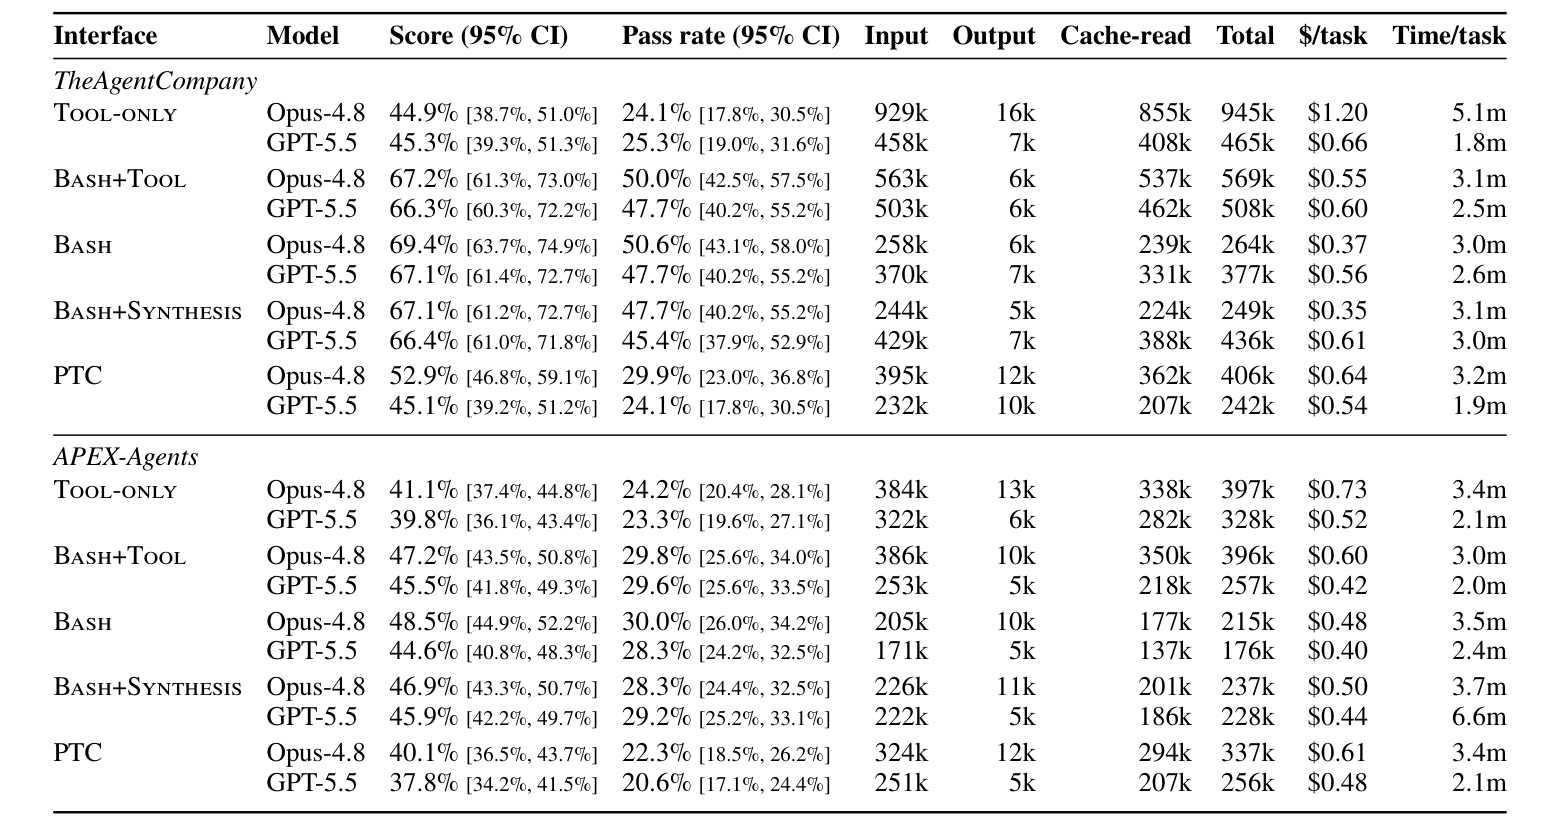
The answers to Q1 to Q3 are all read cell by cell from two of the paper’s summary tables: Table 1 holds the full results for 5 interfaces × 2 models × 2 benchmarks, and Table 9 the paired score gaps. First, score plotted against total tokens (log scale); up and to the left is better:
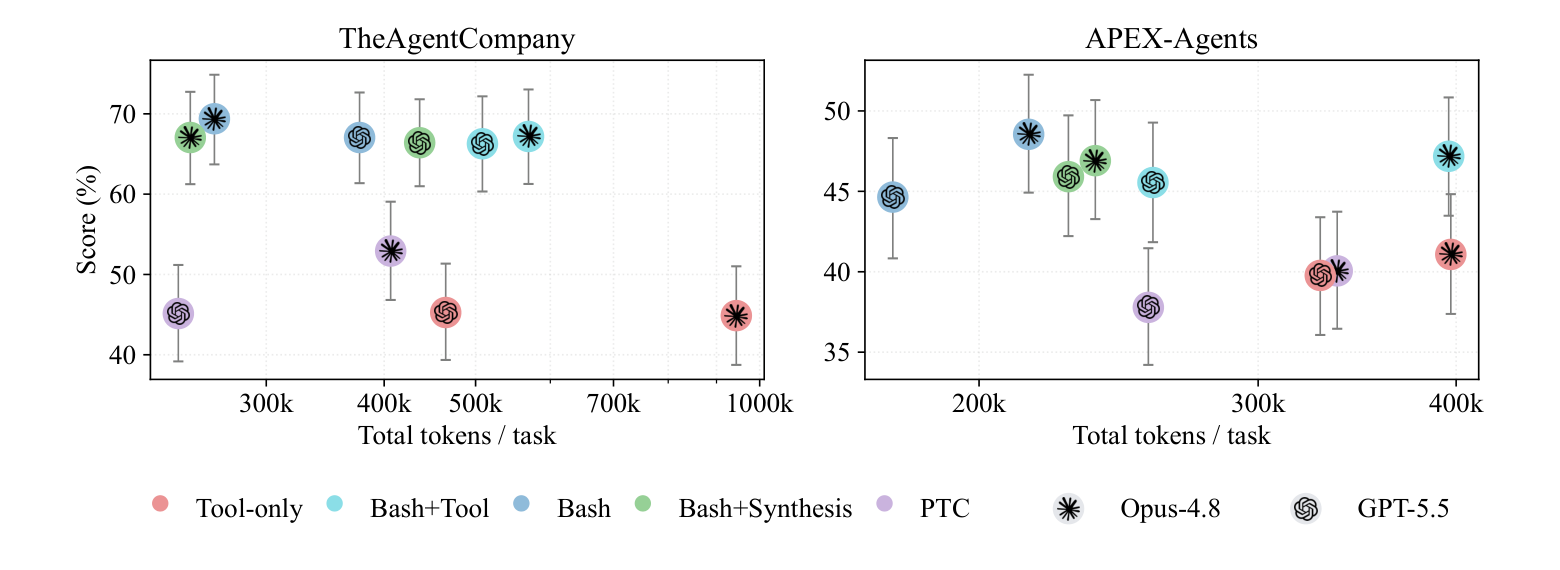
Q1 is the simplest comparison: swap Tool-only for Bash and keep everything else. In the table, the left of each arrow is Tool-only and the right is Bash.
| Benchmark / model | Score | Pass rate | Total tokens | Cost per task (USD) |
|---|---|---|---|---|
| TheAgentCompany / Opus-4.8 | 44.9% → 69.4% | 24.1% → 50.6% | 945k → 264k | 1.20 → 0.37 |
| TheAgentCompany / GPT-5.5 | 45.3% → 67.1% | 25.3% → 47.7% | 465k → 377k | 0.66 → 0.56 |
| APEX-Agents / Opus-4.8 | 41.1% → 48.5% | 24.2% → 30.0% | 397k → 215k | 0.73 → 0.48 |
| APEX-Agents / GPT-5.5 | 39.8% → 44.6% | 23.3% → 28.3% | 328k → 176k | 0.52 → 0.40 |
Table 1 — Excerpt: Tool-only versus Bash in all four settings (Excerpt from the original paper, Table 1.)
All four settings move the same way: scores up, tokens and cost down. The “+21.8 to +24.5 pp” and “+4.8 to +7.4 pp” from the opening are the score column of this table, subtracted cell by cell.
Does it hold up statistically? The table below gives the mean score gap computed over paired tasks (from Table 9). TheAgentCompany’s +24.6 pp is slightly above the cell-by-cell range above (top of 24.5); the two are computed differently, and the paper does not explain the small mismatch.
| Benchmark | Bash − Tool-only | 95% confidence interval | Wins / ties / losses (tasks) |
|---|---|---|---|
| TheAgentCompany (348 task-model pairs) | +24.6 pp | [+20.6, +29.0] | 161 / 172 / 15 |
| APEX-Agents (960 pairs) | +6.2 pp | [+3.6, +8.7] | 220 / 596 / 144 |
Table 9 — Excerpt: paired score gap of Bash over Tool-only (Excerpt from the original paper, Table 9.)
Neither interval includes 0, so within this data the direction “Bash is better” is quite stable. Still, on APEX-Agents Bash lost on 144 pairs; overall it simply won more pairs than it lost. The authors suggest that flexible execution may help coding and cross-application work more than domain reasoning.
5 Adding tools on top of Bash adds tokens, not points
Q2 asks: once there is a shell, does adding more help? The table gives score gaps; positive means adding helped:
| What was added | TheAgentCompany | APEX-Agents |
|---|---|---|
| Bash+Tool − Bash (typed tools added) | −0.6 pp [−3.0, +1.9] | −0.2 pp [−2.4, +1.9] |
| Bash+Synthesis − Bash (self-made scripts added) | −1.6 pp [−3.6, +0.3] | −0.2 pp [−2.4, +2.0] |
Table 9 — Excerpt: paired score gaps from adding things on top of Bash (Excerpt from the original paper, Table 9.)
All four intervals cross 0: no detectable difference. But “not detected” is not “proven absent”: given how wide these intervals are, the experiment can only rule out benefits larger than about 2 to 3 pp; smaller effects are beyond what it can measure. A going-deeper section at the end explains this with a bathroom-scale analogy.
Tokens and cost after adding things (each cell is total tokens / cost per task in US dollars):
| Setting | Bash | Bash+Tool | Bash+Synthesis |
|---|---|---|---|
| TheAgentCompany / Opus-4.8 | 264k / 0.37 | 569k / 0.55 | 249k / 0.35 |
| TheAgentCompany / GPT-5.5 | 377k / 0.56 | 508k / 0.60 | 436k / 0.61 |
| APEX-Agents / Opus-4.8 | 215k / 0.48 | 396k / 0.60 | 237k / 0.50 |
| APEX-Agents / GPT-5.5 | 176k / 0.40 | 257k / 0.42 | 228k / 0.44 |
Table 1 — Excerpt: tokens and cost after adding things on top of Bash (Excerpt from the original paper, Table 1.)
Of the eight cells, only Bash+Synthesis on TheAgentCompany / Opus-4.8 is cheaper than plain Bash, which the paper itself lists as the one exception; everywhere else tokens go up.
6 PTC saves tokens, but the score does not follow
Q3 looks at the compromise, PTC. Swapping Tool-only for PTC (left of the arrow is Tool-only, right is PTC):
| Benchmark / model | Score | Total tokens | Cost per task (USD) |
|---|---|---|---|
| TheAgentCompany / Opus-4.8 | 44.9% → 52.9% | 945k → 406k | 1.20 → 0.64 |
| TheAgentCompany / GPT-5.5 | 45.3% → 45.1% | 465k → 242k | 0.66 → 0.54 |
| APEX-Agents / Opus-4.8 | 41.1% → 40.1% | 397k → 337k | 0.73 → 0.61 |
| APEX-Agents / GPT-5.5 | 39.8% → 37.8% | 328k → 256k | 0.52 → 0.48 |
Table 1 — Excerpt: Tool-only versus PTC in all four settings (Excerpt from the original paper, Table 1.)
Tokens drop in all four cells, but only the first shows a clear score gain; the rest are flat or slightly down. The paired gaps (Table 9) agree:
- PTC − Tool-only: +3.5 pp [+0.8, +6.2] on TheAgentCompany, −1.5 pp [−3.9, +0.9] on APEX-Agents.
- Bash − PTC: +21.2 pp [+17.0, +25.5] and +7.7 pp [+5.2, +10.2]; neither interval includes 0, so Bash is clearly better.
- Tokens: PTC beats Bash only on TheAgentCompany / GPT-5.5 (242k versus 377k).
Why does PTC save tokens? Table 6 breaks down how much PTC batches and how its tokens change (difference from Tool-only; cache reads are the repeated prefix billed at a lower rate):
| Benchmark | Calls per execution | Change in calls | Change in uncached input tokens | Change in cache-read tokens | Change in output tokens |
|---|---|---|---|---|---|
| TheAgentCompany | 2.0 | −4.0 | −97.6k | −86.8k | +0.2k |
| APEX-Agents | 2.0 | −3.0 | −45.4k | −44.0k | −0.4k |
Table 6 — PTC batching and token efficiency (difference from Tool-only, paired by task and model) (Source: original paper, Table 6.)
Batching is modest (only 2 calls per execution on average), yet input and cache-read tokens fall a lot while output barely moves. The authors suggest, without testing it, that this is because intermediate results stay inside the program and only the selected output returns to the model, so the context carried into later turns is shorter, as when the earlier made-up GitLab example returned 20 titles out of 500. A going-deeper section at the end derives the mechanism.
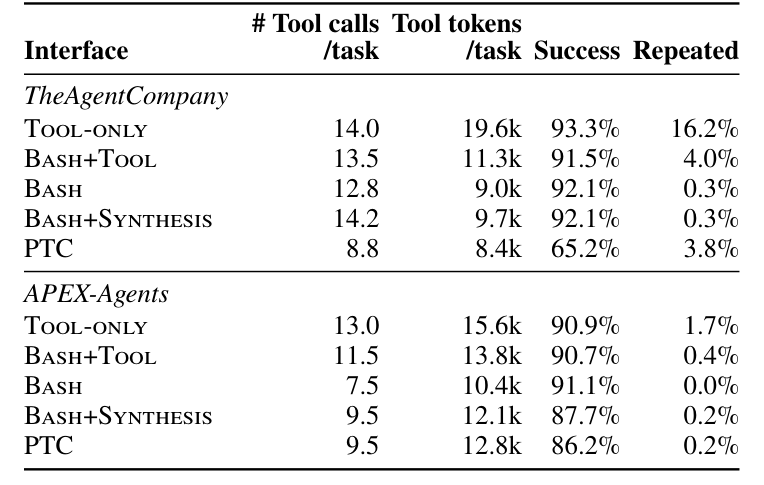
PTC has the lowest tool-call success rate (Table 2): only 65.2% on TheAgentCompany versus about 92% for the other interfaces; 86.2% on APEX-Agents versus about 88% to 91%. The authors guess that “coordinating calls and handling intermediate failures inside a program is harder”, without testing it further.
7 Why Bash does better: agents use the shell to write small programs
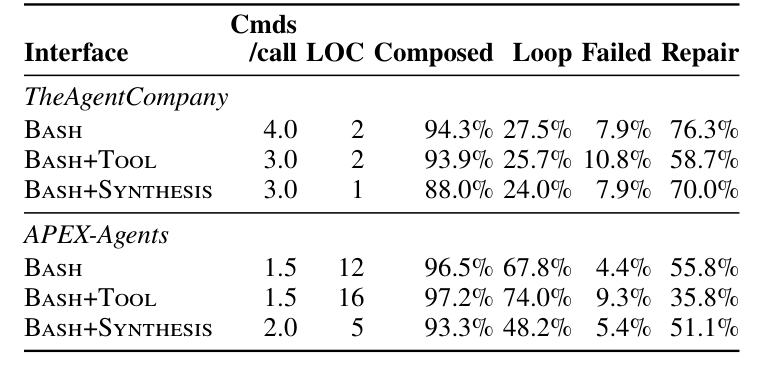
The three questions settled who wins; this section asks why. Two of the extra experiments, tool use and shell usage, point the same way: given a shell, the agent does not run one command at a time but writes small programs that chain several actions into one call. The two most direct numbers: over 94% of shell calls are composed (with pipes, loops, multiple lines and so on), and on TheAgentCompany, exact repeat calls make up 16.2% of calls under Tool-only but only 0.3% under Bash.
- Tool use (Table 2): on TheAgentCompany, call-content tokens are 9.0k for Bash versus 19.6k for Tool-only; on APEX-Agents, the median number of calls is 7.5 for Bash versus 13.0 for Tool-only. The authors’ explanation: the shell can merge repeated actions into one call.
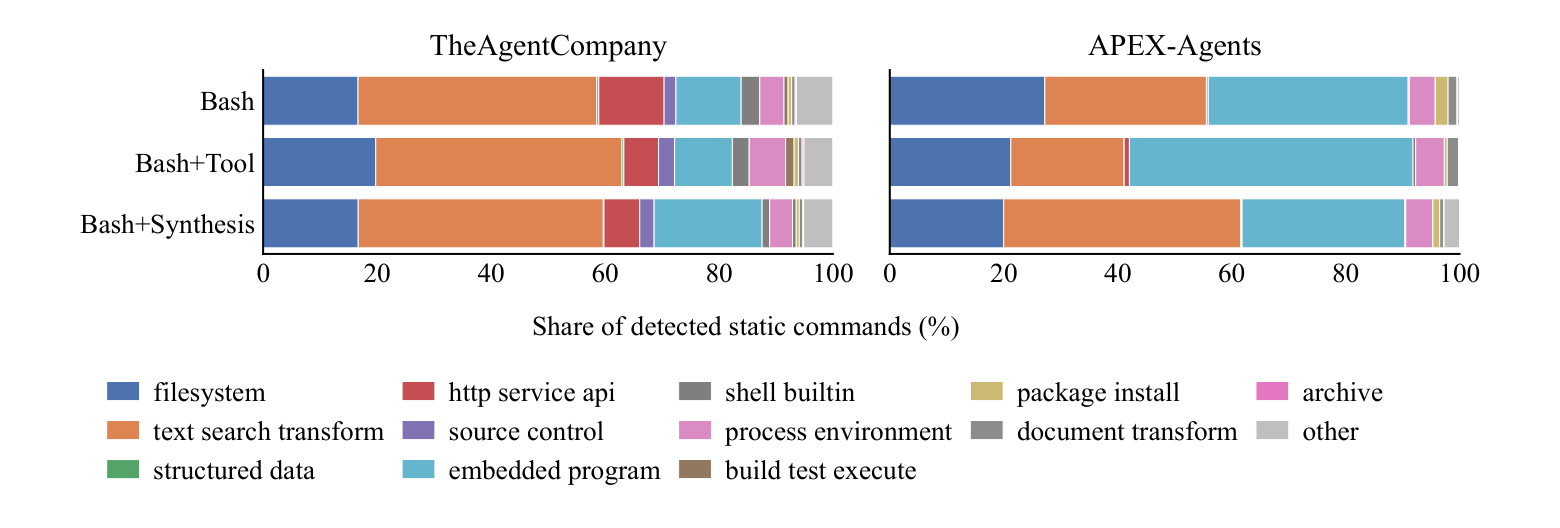
- Shell usage (Table 3, Figure 5): TheAgentCompany leans toward short commands plus HTTP requests, APEX-Agents toward long inline Python. Bash is not just running single commands; it is used to write small programs.
- The shell under Bash+Tool (Table 3): with typed tools available, the remaining shell calls did not get more reliable. Failure rates for Bash+Tool versus plain Bash are 10.8% versus 7.9% (TheAgentCompany) and 9.3% versus 4.4% (APEX-Agents). Adding typed tools only means less shell use; what remains is no better.
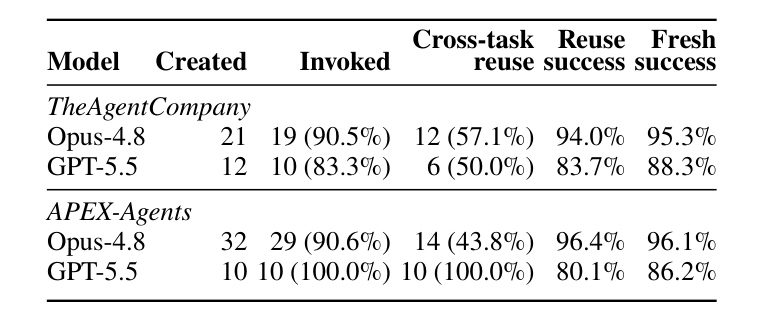
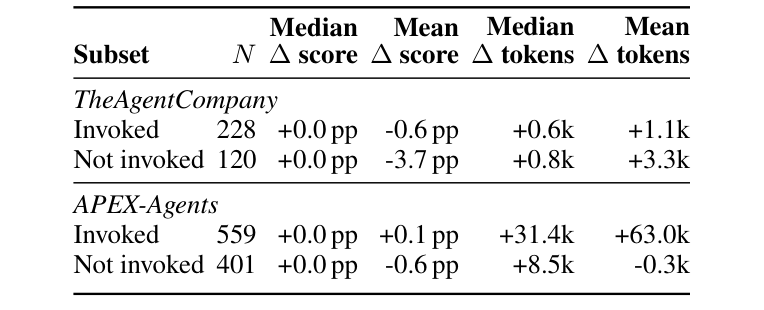
- Self-made tools (Table 4, Table 5): Opus-4.8 created 21 tools on TheAgentCompany, 12 of which were used again in later tasks; for tasks that called a self-made tool, the mean score gap against plain Bash was −0.6 pp (TheAgentCompany) and +0.1 pp (APEX-Agents), and on APEX-Agents the median token count was 31.4k higher. This data shows no value from self-made tools.
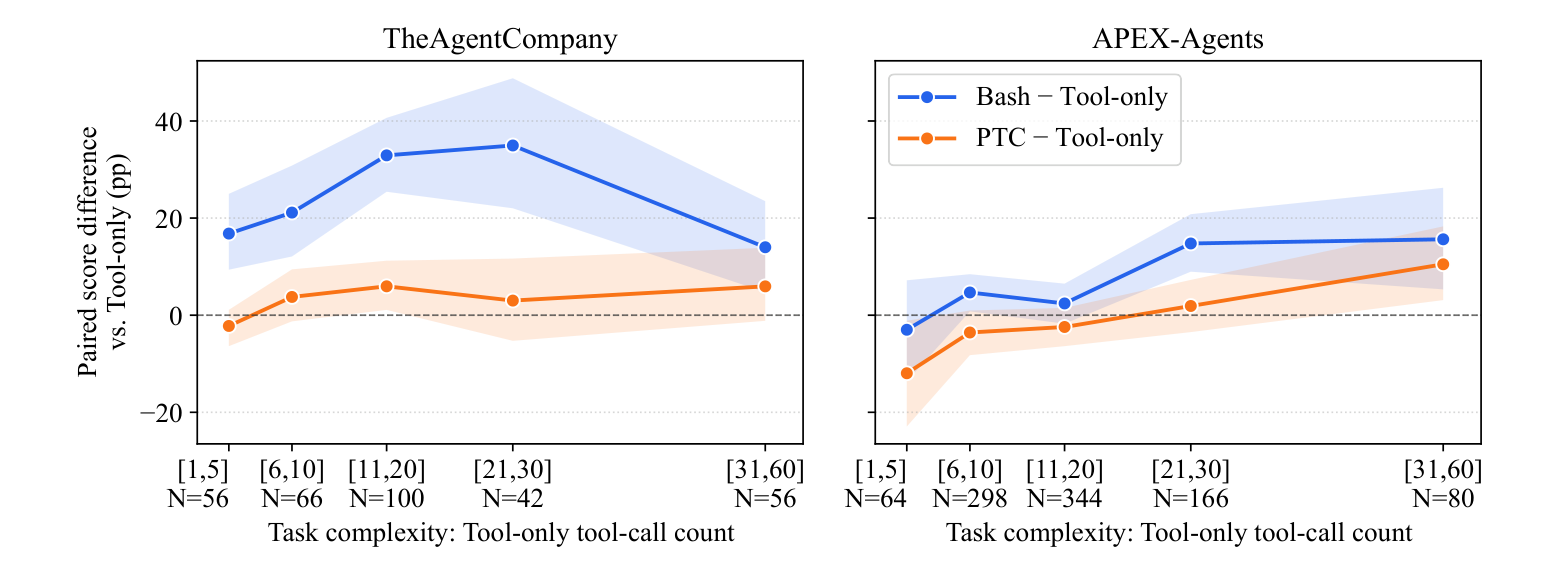
- Task complexity (Figure 4): Bash’s advantage on TheAgentCompany is largest for medium-length tasks; on APEX-Agents, both improve more in the high-call bins; PTC’s confidence intervals mostly cross 0. The evidence is weak; do not treat it as a conclusion.
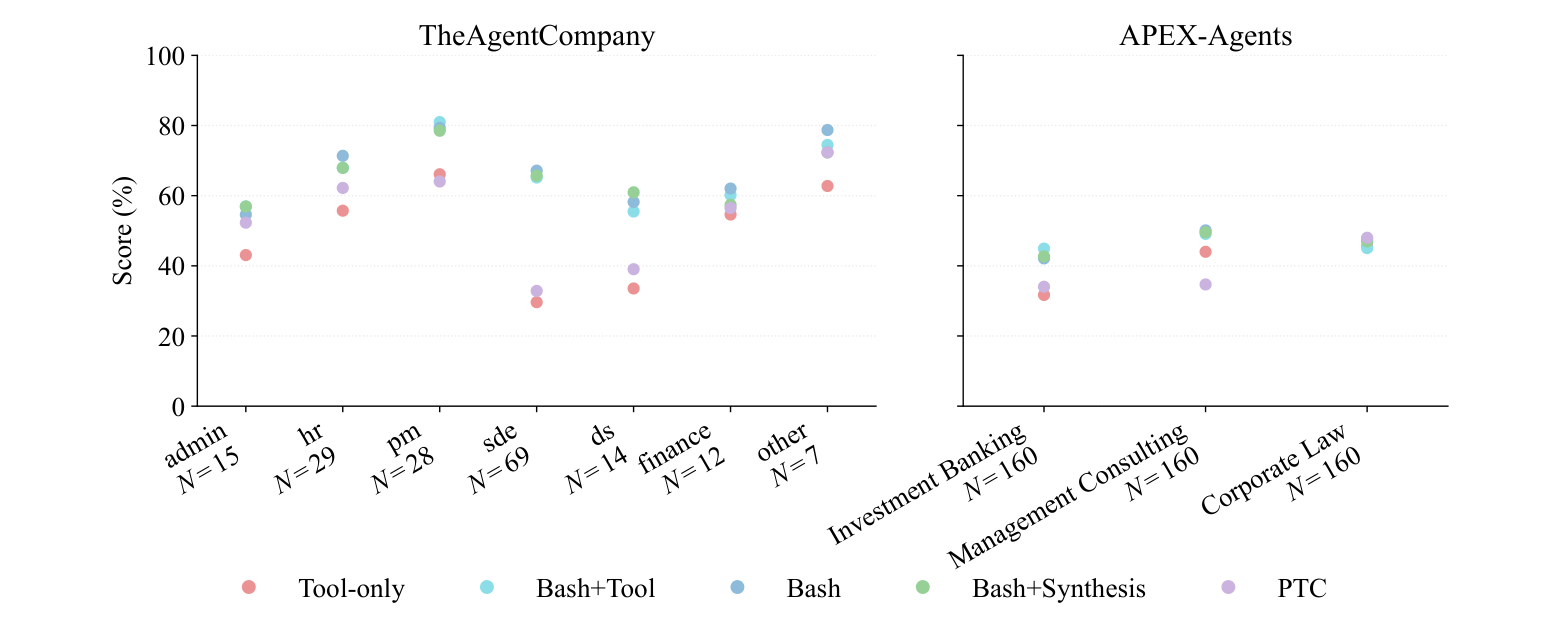
- Scores by domain (Figure 6): in every domain, Bash ≥ Bash+Tool ≥ Tool-only; the gap is largest in software engineering, and corporate law is barely affected by the interface. The interface matters most for coding and cross-system work, least for legal judgment.
First, tool-use statistics: number of calls, tokens in call content, success rate, and the share of exact repeat calls.
Next, shell statistics. “Composed” means a call containing pipes, logical operators, substitution, control flow, multiple lines and similar markers; failure and retry look at whether, after a shell call errors, the next call reuses the same command.
The figure below sorts the shell commands agents actually ran into 12 executable families plus “other”, to see what Bash is really used for.
Reuse of self-made tools, and whether they helped, are in the next two tables.
The task-complexity analysis follows. The x-axis is Tool-only’s number of tool calls, used as a stand-in for task length.
Finally, scores by domain.
8 How much should you trust this evidence?
Low research value. The paper offers no new method and no new analytical framework; its contribution is putting five interfaces into one controlled setting. The value of such a paper depends on whether its baselines are fair, and that is exactly its weakest point (see the weaknesses below).
Moderate engineering value. The direction “Bash scores higher and costs less” holds in all four settings (two models × two benchmarks) and is worth using as input when choosing; “adding typed tools or self-made tools on top of Bash showed no score gain” is also consistent, and comes with more tokens. But the size (especially TheAgentCompany’s +24.6 pp) does not carry over to other systems.
What it does well:
- Clean controls: same model, same task text, same base prompt, same stopping rule; only the interface changes.
- Careful statistics: paired comparisons with bootstrap confidence intervals, not just averages.
- Tokens and cost per task sit in the same table as scores, which is more useful for real decisions than scores alone.
- It is honest about reward hacking, including how it was blocked (Appendix B.1).
Where it falls short, the first point matters most for how to read the results:
- The Tool-only baseline is not neutral. Besides TheAgentCompany’s 60 self-built typed tools (see the Q1 section), PTC’s Python runtime was also implemented by the authors. APEX-Agents’ 20 tools came with the benchmark and are relatively clean, though not perfectly clean (my inference).
- Bash’s risk is not part of the score. The paper recommends “Bash when arbitrary execution can be isolated”, but neither the cost of isolation nor security incidents were quantified, and the experiment itself caught agents pulling answers from grading scripts. The value of typed tools for output curation, access control and auditing is not in the score either.
- Run-to-run randomness is not quantified on its own. The paired counts are 348 = 174 × 2 and 960 = 480 × 2, which suggests each “task × model” ran only once (my inference; the paper does not say). The confidence intervals resample tasks, so the “no detectable difference” results (adding typed tools, self-made tools) can rule out only effects of limited size.
Is the abstract spun? Not obviously: its 21.8 to 24.5 pp and 4.8 to 7.4 pp are exactly the range of the four results. But it puts TheAgentCompany first, the benchmark with the larger gap and the worst baseline problem.
9 How to choose: ask about compliance first, then isolation
What to take away:
- Bash scores higher and costs less. All four settings agree; TheAgentCompany’s +24.6 pp is mixed with a self-built baseline, so for the size, APEX-Agents’ +6.2 pp is the more trustworthy figure.
- Adding things on top of Bash showed no score benefit. Typed tools and self-made tools only added tokens; intervals that cross 0 only mean effects larger than about 2 to 3 pp were not detected.
- PTC is a compromise. It saves tokens, holds scores flat and loses to Bash, and part of that loss may just be catalog coverage.
The paper itself leaves you with little; what lasts are the habits of judgment that came out of reading it. What the paper itself contributes:
- A controlled data set: scores, tokens and costs for five interfaces under one setup. Trust the direction; do not copy the size (see the previous section).
- A reward-hacking case: agents with a shell pulled answers from grading scripts instead of doing the work (Appendix B.1). That is a warning for any experiment that gives an agent a shell and then grades it on a benchmark: if the environment can reach the grader, the scores cannot be taken at face value.
- Close to zero methodological contribution: all five interfaces are combinations of existing practice.
These habits hold beyond this paper; the going-deeper sections at the end work through each one:
- When you see “A beats B”, check who built B: however weak the baseline was made gets mixed into the result.
- The key to saving tokens is keeping bulky intermediate data out of the context: every token in the context is paid for again on every later turn.
- “Can batch” and “can reach” are different things: Bash and PTC can both batch; they differ in what they can touch.
- Typed tools plus exec (a tool that runs shell commands): the paper does not show this hybrid beating plain Bash, and did not measure the stability that curated output might bring.
- “No detectable difference” is not “no difference”: the width of the confidence interval decides how small an effect the experiment can detect.
A rule for choosing a tool interface. The paper’s advice is conditional; as a decision order, ask about compliance first, then about isolation:
| Order | Question | If yes | If no |
|---|---|---|---|
| 1 | Does compliance require calling only approved, fixed tools? | Use PTC | Ask the next question |
| 2 | Can arbitrary code execution be isolated? | Use Bash | The paper does not address this case directly; falling back to Tool-only is my inference |
Stacking typed tools or self-made tools on top of Bash is not on this path, because the paper saw no score benefit; if you add them, the reason has to be a value other than score.
The paper also gives model advice: use Opus-4.8 first for shell-heavy coding and cross-application work; use GPT-5.5 for token-efficient direct typed-tool calling; for document-heavy professional analysis, trade off Opus-4.8’s higher quality against GPT-5.5’s lower token use. The authors themselves note that this advice may not survive model updates, so it has the shortest shelf life.
Next time you see “new method crushes the baseline”, first ask who built the baseline, then check how wide the confidence interval is. When you design an agent, ask about compliance first, then isolation, and watch for any tool that is dumping a whole stack of results into the context.
A note on labels: setup and results without a label come from the paper; the assessment in “How much should you trust this evidence?” and the habits in the going-deeper sections are the note author’s views. “My inference” marks the note author’s guess, “made-up example” marks scenarios and numbers invented for illustration, “general knowledge” marks background from outside the paper, and “the paper does not say” marks what the paper leaves out.
10 Going deeper: when A beats B, check who built B
The five sections below are habits of judgment worked out while reading the paper. Each holds beyond it; to review quickly later, these are enough.
Any result of the form “new method A beats old method B” equals the method’s own merit plus how weakly B was built; when B was designed by the proposer, the second part is often underestimated.
Taking a comparison apart. As a formula, with noise added as a third term:
- Observed gap: the A minus B you see in the paper’s table.
- A’s own merit: what we actually want to know.
- Shortfall from a weak B: the gap caused by the baseline being designed, tuned or scoped less well than A.
- Noise: randomness in tasks and models, estimated with confidence intervals.
A paper can only measure the left-hand side, the total gap you see in the table (noise is estimated with the confidence interval); how much of that gap is “A’s own merit” and how much is “shortfall from a weak B” is left to the reader to judge.
Two layers of confounding in this paper.
| Comparison | What else is mixed in | A relatively clean reference |
|---|---|---|
| Bash vs Tool-only (TheAgentCompany, +24.6 pp) | Tool-only’s 60 tools were designed by the paper’s authors and cover only task-relevant APIs, not every endpoint a shell can reach (Appendix B.1) | APEX-Agents’ 20 tools came with the benchmark, and the gap there is only +6.2 pp |
| Bash vs PTC (+21.2 pp and +7.7 pp) | PTC can only call functions in the catalog, so the gap mixes “how programmatic calling works” with “whether the catalog is enough”; PTC’s restricted Python runtime was also implemented by the authors | The paper provides none |
Mind the scope: Appendix B.1’s “the catalog covers only task-relevant APIs” refers only to the 60 tools built for TheAgentCompany, so this confound mainly affects TheAgentCompany’s results.
The gaps on the two benchmarks differ by a factor of four (+24.6 versus +6.2), and the paper does not break down why. My inference: at least part comes from TheAgentCompany’s baseline being self-built, and part from different task types (coding and cross-system work versus professional analysis). How much each contributes, this data cannot say.
A three-question check.
- Who designed the baseline? If the proposer built it, assume it was not tuned to its best.
- Did it get the same effort? The same prompt tuning, the same hyperparameter search, the same tool coverage.
- Is there a baseline from another source to cross-check? If two sources give very different gaps, baseline quality is affecting the result. This paper happens to have one: a self-built catalog and the benchmark’s own catalog.
Other common baseline traps (general knowledge, not from the paper):
- The baseline uses default hyperparameters while the proposed method was tuned.
- The baseline’s prompt was not adapted to it.
- The baseline uses a weaker model or a smaller compute budget.
- The two sides use different harnesses (execution environment and grading program).
Using this in your own evaluations. Treat the baseline as a system that deserves real effort: give it the same tuning budget as the new method, and find an outside baseline to compare against where you can. When reporting, pick out the two numbers that differ in only one variable under the same conditions; that pair is the method’s own merit.
11 Going deeper: why keeping intermediate results out of the context saves tokens
The model rereads everything so far on every turn, so every token that enters the context is paid for again on every later turn; keeping bulky intermediate data outside the model is the most direct saving. The mechanism in this section is general knowledge, not from the paper; the paper offers only Table 6 as indirect evidence.
Two terms first.
- Context: all the text the model reads each time it is called, including the system prompt, the task description, every earlier turn’s actions, and every tool result.
- Stateless: the model itself has no memory across calls. On every turn the system resends the whole context, and that is the only way the model “remembers” what happened.
Every token in the context is counted again and again. In plain words first: a tool result that enters on turn is read again on every turn from to , so its cost is “size times remaining turns”. As a formula, total input tokens are the sum of the context length read on each turn, and each turn’s length is the starting context plus every earlier turn’s model output and tool results:
- : how many turns the task takes in total.
- : the context length the model reads on turn .
- : the starting context (system prompt plus task description).
- : the tokens the model itself outputs on turn .
- : the tokens a tool result adds to the context on turn .
So any saving on is multiplied by the number of turns.
Step-by-step arithmetic (made-up example). Back to the GitLab task: 500 issues, 20 of which match. Assume each full issue is about 200 tokens, each title about 20 tokens, the starting context is 5,000 tokens, and the task needs 9 more turns after the result arrives; the model’s own output is the same either way, so ignore .
| Approach | Result entering the context after turn one | Context read on each later turn | Total over the next 9 turns |
|---|---|---|---|
| Tool-only (all 500 full results enter the context) | 500 × 200 = 100,000 tokens | about 105,000 | about 945,000 |
| Bash or PTC (only 20 titles enter the context) | 20 × 20 = 400 tokens | about 5,400 | about 48,600 |
About 19 times apart (every number here is an assumption, not a result from the paper). The same thing in code (the first turn’s 5,000 is the same for both; the comparison is over the next 9 turns):
def total_input(L0, results, turns):
    ctx, total = L0, 0
    for t in range(turns):
        total += ctx                 # this turn reads the whole context
        ctx += results.get(t, 0)     # this turn's tool result enters the context and is reread every later turn
    return total

total_input(5_000, {0: 100_000}, 10)   # about 950K (Tool-only)
total_input(5_000, {0: 400}, 10)       # about 50K (Bash/PTC)
Real systems usually have prompt caching: a repeated prefix is reread at a lower price. That lowers the price but not the token count; the input tokens in the paper’s results table (Table 1) include cache reads too. So “keep bulky data out of the context” still holds with caching; the dollar gap just shrinks.
The paper’s indirect evidence, and its limits. The evidence is Table 6 in the PTC section: against Tool-only, uncached input and cache reads both fall sharply while output barely moves, and each execution batched only 2.0 calls on average, so the saving is mostly not about the number of calls. The authors’ explanation: intermediate results are processed in the program and only the selected output comes back, so the context carried into later turns is shorter. They phrase it as “may” (may reflect) and did not test it directly.
Other ways to cut the tokens entering the context (general knowledge):
| Approach | How | When it fits | Cost |
|---|---|---|---|
| Curate output in the tool | Filter, pick fields, truncate or paginate inside the typed tool before returning | You control the tool’s implementation | Every tool needs design work; poor curation drops needed information |
| Let the agent process it in code | Bash pipes or PTC’s Python keep intermediate results inside the program | Large data, fixed processing steps | Needs an execution environment and security controls |
| Context compression | Replace old content with a summary when the conversation gets long | Long-running tasks | Summaries can lose detail |
| Sub-agent | Hand heavy reading to a separate context and return only the conclusion | Lots of searching or reading | Extra coordination cost |
| Caching | Reread a repeated prefix at a lower price | Long conversations with a stable prefix | Lowers price only, not token count |
Rule of thumb: first ask “is this result large, and will I need the original again?” If it is large and only a small part matters later, do not let it enter the context whole; pick one of the first three approaches above. If it is small, or every later turn needs the original, put it straight into the context.
12 Going deeper: batching is not unique to PTC; reach is the difference
Bash and PTC can both fold several actions into one model call; the real difference is what environment each can reach. So “is this benchmark unfair to PTC?” and “why did PTC lose to Bash?” should be thought about separately.
Batching, defined. One model call (one turn) performs several actions on the environment, cutting round trips between model and tools and cutting the intermediate results that enter the context (mechanism in the previous section).
How each interface batches. A made-up example: read 30 contract PDFs and find each one’s effective date.
[Tool-only] one call per contract, 30 calls, each full result goes back to the model
  read_pdf("c01.pdf") -> full text ...  read_pdf("c30.pdf") -> full text

[Bash] one call, chained with a loop and a pipe
  for f in *.pdf; do echo "$f"; pdftotext "$f" - | grep -i "effective date"; done

[PTC] one execution, a Python loop over catalog functions
  for f in list_files("*.pdf"):
      text = read_pdf(f)                       # a typed function from the catalog
print(f, find_line(text, "effective date"))| Interface | Can it batch? | Evidence in the paper |
|---|---|---|
| Tool-only | No; every action is a separate call | Table 2: exact repeat calls are 16.2% (TheAgentCompany); the authors’ explanation is that it exposes every repetition as a separate call |
| Bash | Yes: pipes, &&, loops, heredocs (multi-line text embedded in a command), inline scripts | Table 3: 94.3% and 96.5% of shell calls are composed; calls with loop markers are 27.5% and 67.8%; Table 2: on APEX-Agents the median number of calls is 7.5 versus 13.0 for Tool-only |
| PTC | Yes: Python loops, chaining, parallelism, but only over catalog functions | Table 6: each execution batched only 2.0 typed tool calls on average |
“Is this benchmark unfair to PTC?” Having seen PTC lose to Bash, a natural question is whether these two benchmarks simply suit PTC poorly. PTC’s edge comes from looping over many calls; if a task only needs a dozen or so calls, the edge never shows. possibly, but the paper did not test it directly. The evidence:
- For the hypothesis: the median number of Tool-only calls per task is only 14.0 (TheAgentCompany) and 13.0 (APEX-Agents), and PTC batched only 2.0 calls per execution on average, which is not a heavy-looping workload.
- Partly consistent: in the task-complexity figure (Figure 4), PTC’s mean score gap turns positive in APEX-Agents’ high-call bins. But the authors themselves note that PTC’s confidence intervals cross 0 in most bins, so the evidence is weak.
- High-call tasks are a minority: the 31-to-60-call bin holds only about 16% (56/348) and 8% (80/960) of the paired tasks (computed by the note author from the per-bin task counts in Figure 4).
- The paper does not say: it splits scores by call count but not token savings, so “the more calls, the more PTC saves” is plausible but unverified.
The real difference: reach.
| PTC | Bash | |
|---|---|---|
| Can batch | Yes | Yes |
| Can reach | Only functions in a fixed tool catalog | The file system, arbitrary commands, the network: anything a shell can touch |
| Security relies on | The fixed tool catalog (no shell) | Isolation, file-system limits, execution caps |
So even if tasks shifted to heavy repeated calling, the advantage would go to Bash and PTC alike; PTC has no batching ability Bash lacks, so the ranking between them would not flip (my inference). Conversely, part of PTC’s +21.2 pp and +7.7 pp loss to Bash may just be catalog coverage (Appendix B.1), and that confound sits mainly in TheAgentCompany, where the catalog was self-built. The paper does not separate “how it works” from “catalog coverage”.
Rules of thumb.
- Lots of repeated calls, and the catalog already covers the needed actions: PTC and Bash both beat Tool-only on cost; they differ in how they are governed.
- You need to touch things outside the catalog: only Bash can.
- Compliance requires calling only approved, fixed tools: PTC, which keeps batching without opening a shell.
13 Going deeper: typed tools plus exec, and what the paper did not test
Giving an agent a set of typed tools plus one exec tool (which runs shell commands) is a common real-world setup; it is the paper’s Bash+Tool. The data says it is far better than typed tools alone and not detectably different from plain Bash, but the typed tools tested were not necessarily ones with carefully curated output.
The paper’s data.
The paper’s numbers have all appeared already. Bash+Tool’s gain over Tool-only (TheAgentCompany +24.1 pp [+20.1, +28.3], APEX-Agents +5.9 pp [+3.6, +8.3]) is about the same as plain Bash’s; against plain Bash it shows no detectable score difference (the Table 9 excerpt in Q2), yet uses noticeably more tokens (the Table 1 excerpt in Q2), and its shell calls fail more often (the section on why Bash does better).
The paper (§5.4) says: with typed tools added, the shell is used less, but the remaining shell calls are no more reliable. In tasks that use the shell, Bash+Tool has the lowest median number of shell calls, yet the highest failure rate and the lowest immediate-retry rate.
Three things the paper did not test.
- Whether typed-tool output was curated: the paper lists the tools but not how much their returned content was processed (the paper does not say).
- Stability: the paper reports mean scores and confidence intervals, not the variation across repeated runs of the same task; paired counts of 348 = 174 × 2 and 960 = 480 × 2 suggest a single run (my inference).
- Access control and auditing: these are not in the score.
So the practical argument “typed tools with processed output bring stability” is neither supported nor refuted by the paper.
The case for curated output (a practical argument: general knowledge plus my inference). Exec returns raw output: variable length, no fixed format, possibly with noise or information the model should not see. A typed tool can process it before returning:
- Consistent format: structured results with fixed fields, so the model does not have to guess how to parse them.
- Length control: truncation and pagination, plus a note on how much is not shown.
- De-identifying or masking sensitive fields.
- Standardized error messages, so the cause of a failure is clear.
A made-up example, the same “find issues with bug in the title” task. On the typed-tool side, output is curated before it returns:
def search_issues(project, keyword, limit=20):
    raw = gitlab_api.list_issues(project, state="opened")   # possibly hundreds of issues
    hits = [i for i in raw if keyword.lower() in i["title"].lower()]
    return {
        "total_matched": len(hits),
        "items": [{"id": i["iid"], "title": i["title"], "url": i["web_url"]} for i in hits[:limit]],
        "truncated": len(hits) > limit,          # tell the model explicitly whether there is more
    }
The exec side returns raw text, whose format depends on the command the agent wrote; it can run from a few lines to hundreds, and an error comes back as curl’s or jq’s raw error message:
$ curl -s $GITLAB/api/.../issues | jq -r '.[].title' | grep -i bugThis is the same mechanism as before: curated output means fewer tokens entering the context. My inference: a typed tool with well-designed output can get the same token savings that PTC and Bash get by other means, plus a predictable input format.
A security note (my inference). As long as the agent has exec, a typed tool cannot serve as a permission boundary on its own: the agent can curl the same API directly and bypass the typed tool’s limits. If you chose typed tools for access control or auditing, make sure exec cannot get the same credentials and network paths; otherwise having both amounts to no limit at all. The paper places the value of a fixed tool catalog in security and compliance, and that value holds only when there is no shell.
How to test it (the note author’s suggestion, not from the paper). On the same tasks with the same model, compare two conditions: exec only, and typed tools (with curated output) plus exec. Run each condition at least 3 times and compare not just mean scores but the variation in score across repeated runs of the same task, plus token use. If curated output mainly buys stability, mean scores may show no difference while the variation does.
14 Going deeper: no detectable difference is not no difference
An experiment can only say “the score difference between the two approaches was not clear enough to confirm in this data”, not “guaranteed to have no effect”; the width of the confidence interval is a rough measure of the smallest gap the experiment can detect.
With the paper’s numbers. On TheAgentCompany, Bash+Tool − Bash has a mean gap of −0.6 pp with a 95% confidence interval of [−3.0, +1.9].
- Confidence interval: given this data, we are 95% confident the true gap falls in this range.
- The lower end is −3.0 (adding typed tools makes it 3 pp worse), the upper end is +1.9 (adding them makes it 1.9 pp better), and 0 is in between.
- So the data cannot tell “really no difference” apart from “a small benefit or harm of about 2 pp”.
An analogy: a bathroom scale that is only accurate to plus or minus 2 kg. Eat a meal and gain 0.5 kg, and it will not show; that does not mean you did not gain weight, only that the scale’s noise is bigger than the change. The analogy works because randomness in tasks and models makes the mean gap jitter within a range, and an effect smaller than that jitter gets drowned out.
How bootstrap works (general knowledge; the paper only says “95% bootstrap CIs” and gives no details):
import random

def bootstrap_ci(diffs, n=10000):
    # diffs: the score gap of each paired task, e.g. 348 numbers
    means = []
    for _ in range(n):
        sample = [random.choice(diffs) for _ in diffs]   # draw with replacement, as many as the original
        means.append(sum(sample) / len(sample))          # mean gap of this resample
    means.sort()
    return means[int(0.025 * n)], means[int(0.975 * n)]   # the middle 95% range
The more tasks, the steadier the resampled means, the narrower the interval, and the smaller the gap that can be detected.
Three moves when you read “no detectable gain”.
- Look at the interval width: roughly plus or minus how many pp?
- Ask how big the effect you care about is: if the benefit you care about is only 1 to 2 pp (say, a small gain in stability), this experiment could never have measured it.
- Check whether other metrics say something: for example whether tokens went up or failure rates rose, which can cover what the mean score misses.
What it means for this paper. “No detectable difference” in score from adding typed tools or self-made tools rules out only “benefits larger than about 2 to 3 pp”; smaller effects this experiment can neither prove nor rule out.